
At a glance
- The challenge
- Growth was in single digits, 6% for ARC and 8% for Morningstar Investor, and trending down. Three research platforms served advisers and investors with overlapping content, each with its own navigation, tools and sign-up path, and they were costly to run.
- What I did
- Ran discovery end to end, then designed the membership levels, the sign-up flow and the screens for Investor Pro, the new unified product.
- Where it landed
- One product with five membership levels, a navigation structure proposed from user research, a shorter path from visitor to member, and more than 100 screens on one design system. The System Usability Scale score rose from 59 to 88, and the Net Promoter Score from 29 to 67.
- 3 → 1platforms brought into one product
- 5membership levels, from visitor to enterprise
- 100+screens, at three screen sizes
- 370+components in one shared library
- 59 → 88System Usability Scale, old Screener to new
- 29 → 67Net Promoter Score
01 · Challenge
What the product does
Morningstar is an independent investment research company. Its Australian subscription, Morningstar Investor, gives people who manage their own money analyst research and ratings, tools to find and compare investments, and a way to track a portfolio. Advisers get the same research through a separate product. Investor Pro is the new product that brings them together in one platform.
Research
Know what to buy
Analyst reports and ratings on shares, funds and ETFs.
Tools
Find and compare
Screener, watchlists, alerts and side-by-side comparison.
Portfolio
Track what you hold
Portfolio tracking, X-ray analysis and reporting.
Editorial
Stay informed
Market news, personal finance and guides to investing.
Three platforms, one audience
Morningstar's research offering in Australia sat on three separate platforms: two paid products, ARC and Investor, and the public site, DFD.
01
ARC
A research landscape for advisers: investment research, portfolio research and analyst insights.
02
Investor
Supports logged-in investors with research, tools to track and manage portfolios, and learning.
03
DFD
Supports visitors, and drives acquisition through marketing and SEO.
They served similar core needs, but operated as separate products rather than one unified experience, with separate teams and separate technology behind them.
The problem
We worked with stakeholders to reach a single statement the whole team could point to.
Problem statement
Our research platforms were designed to support both professional advisers and individual investors with market insights, portfolio research, reporting and tools. While they serve similar core needs, they operate as separate products rather than a unified experience, and they are no longer meeting their goals for user growth, retention and operational efficiency.
Four things were driving it:
- Fragmented experiences across multiple products
- Duplicated technology stacks
- Limited personalisation
- An ageing adviser product
How we framed it: four questions with stakeholders
Before proposing anything, we needed a shared view of the problem. We worked through four questions with stakeholders, captured the answers on sticky notes, and looked for what they had in common.
Question 1
What are the current goals of the products?
Give advisers and investors a way to research the market, get insights, and track and manage their portfolios.
Question 2
What problem do stakeholders want addressed?
Products serving the same purpose for different users, duplicated technology stacks, and an ageing adviser product.
Question 3
Which goals aren't being met?
Two teams looking after two products with very similar features isn't sustainable. We don't know our users well enough, personalisation is limited, there is no AI assistance for research, and new experiences are slow to reach the market.
Question 4
What is the request, without dictating a solution?
Consolidate down to one product. Show the value we offer, help users achieve their goals, and bring price tiering in line with market standards.

The opportunity
Opportunity statement
There is an opportunity to unify our research platforms to deliver a more consistent experience across advisers and investors, improving engagement, retention and revenue while reducing operational complexity.
By reducing fragmentation, consolidating overlapping capabilities and improving personalisation, we could increase engagement and retention while improving operational efficiency and supporting sustainable growth.
How might we streamline our research platforms to deliver a more consistent and cohesive experience for both advisers and investors, so that we reduce fragmentation and duplication while improving engagement, retention and revenue growth? How might we
A shared core, with differences by level
Partway through discovery the team decided to consolidate, so the framing workshop was not about adviser and investor as separate products. It was about defining a shared core, and the differences by entitlement.

The open questions and workstreams we started with
Open questions we had to answer
- Where does the line sit between investor-level workflows and adviser-level capability?
- How should tiers differ: by throttling, by packaging, or by feature sets?
- How do advisers buy, get billed for, and get access to the product?
- What are the gaps between today's products and the unified platform?
Design workstreams
- Investor UX and UI
- Transition to the global UX
- Buying journey
- Log-in journey
- Tool integration, uplifting the current tools
02 · Role
My role
I was the designer on the project, responsible for workshops, discovery, design and testing. I oversaw all the design journeys and workflows and the look and feel, validated the design as it took shape, and ran workshops to keep the project on track.
- Workshops: planning and running the sessions that moved the team forward
- Discovery: framing the problem, the users and the risks
- Design: every journey and workflow, and the look and feel
- Testing: validating the design before committing to it
A cross-functional team
We started with a roles and responsibilities session. Each person wrote down what they were responsible for and how they would contribute, using the RACI model (responsible, accountable, consulted, informed), so ownership was clear before the work began.

The six functions on the team
Business
Growth and delivery
Accountable for a growing, scalable business and for the success of delivery.
Product
Packaging, pricing and value
Packaging, pricing and value proposition, with expertise in audience and analytics.
Domain
Adviser and investor expertise
Subject-matter experts across both segments, and the voice of the adviser.
Engineering
Technical delivery
Coordinating delivery, keeping ideas dev-ready, and hitting milestones.
Architecture
Technology choices
Technology validation and selection, solution building and architecture.
Design
Experience (my role)
Workshops, discovery, design and testing across every journey.
03 · The product
What we had: an audit of six sites
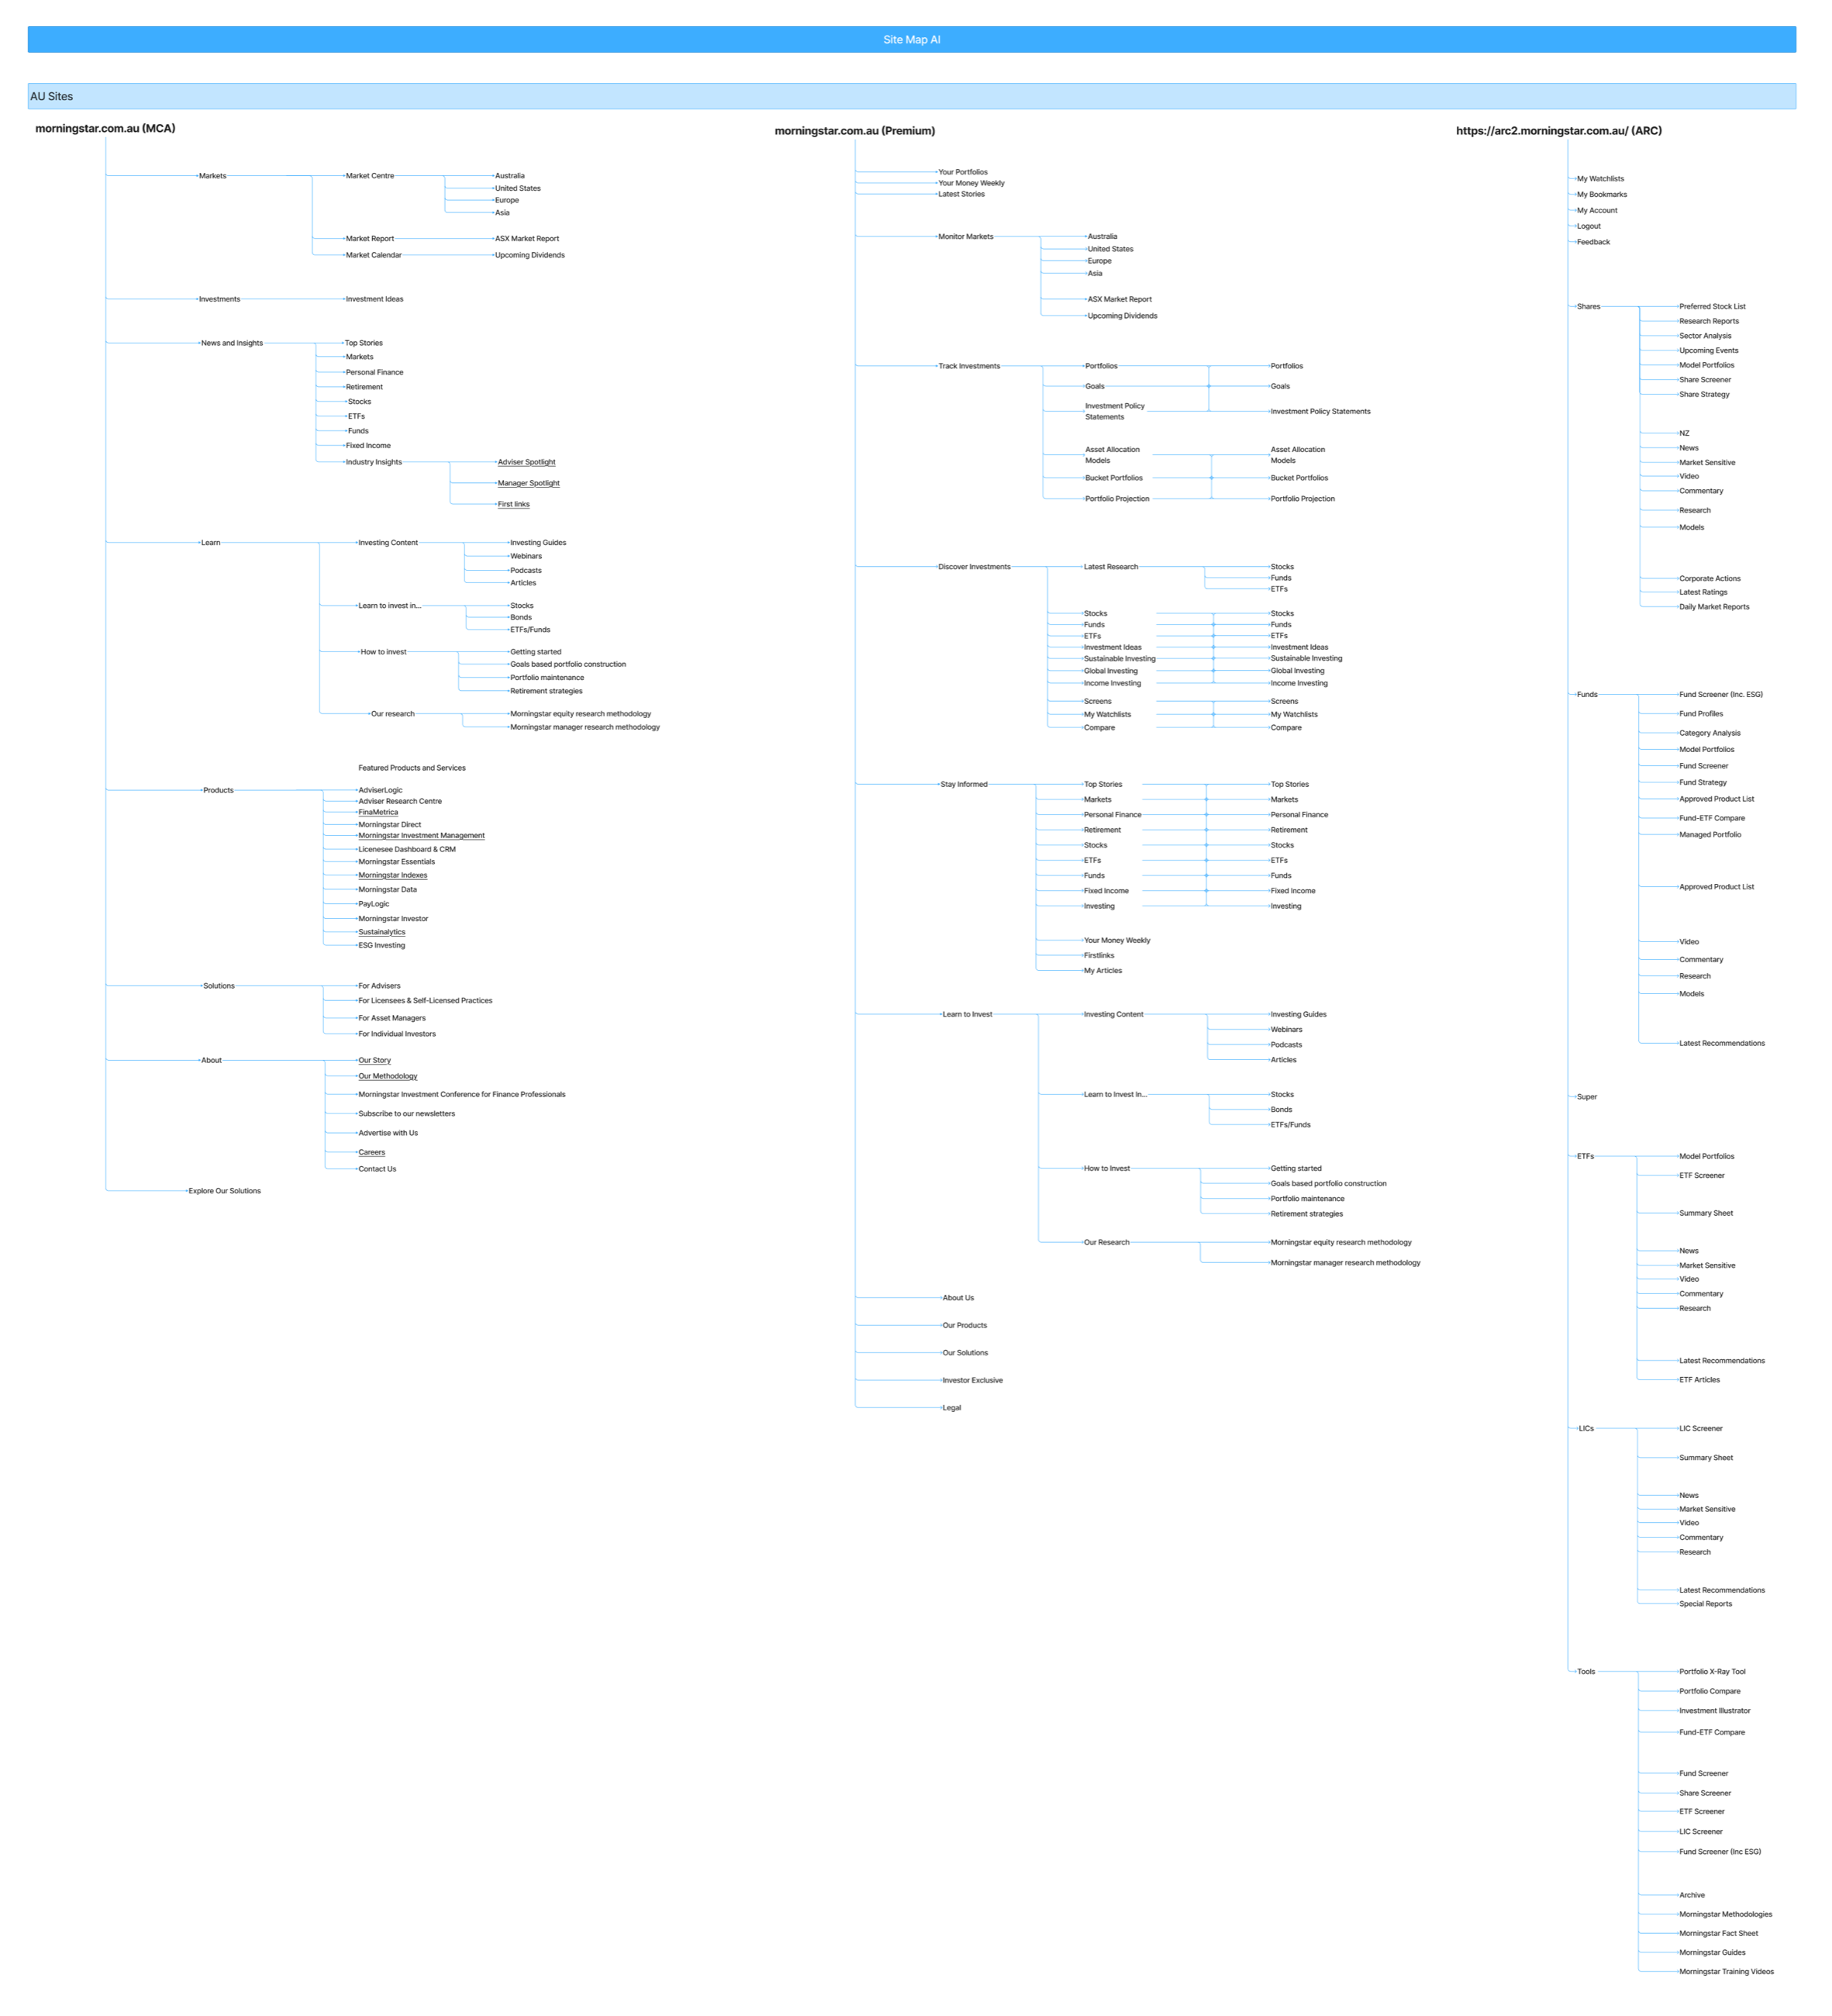
You can't unify what you haven't mapped. Before designing anything new, I audited the existing estate on one board: the site map of every site, the journeys between them, the tools each product offers, and how Morningstar's sites in other markets solve the same problems.
6
sites mapped, in Australia and globally
~400
navigation items catalogued
3
other markets reviewed: UK, France, Sweden
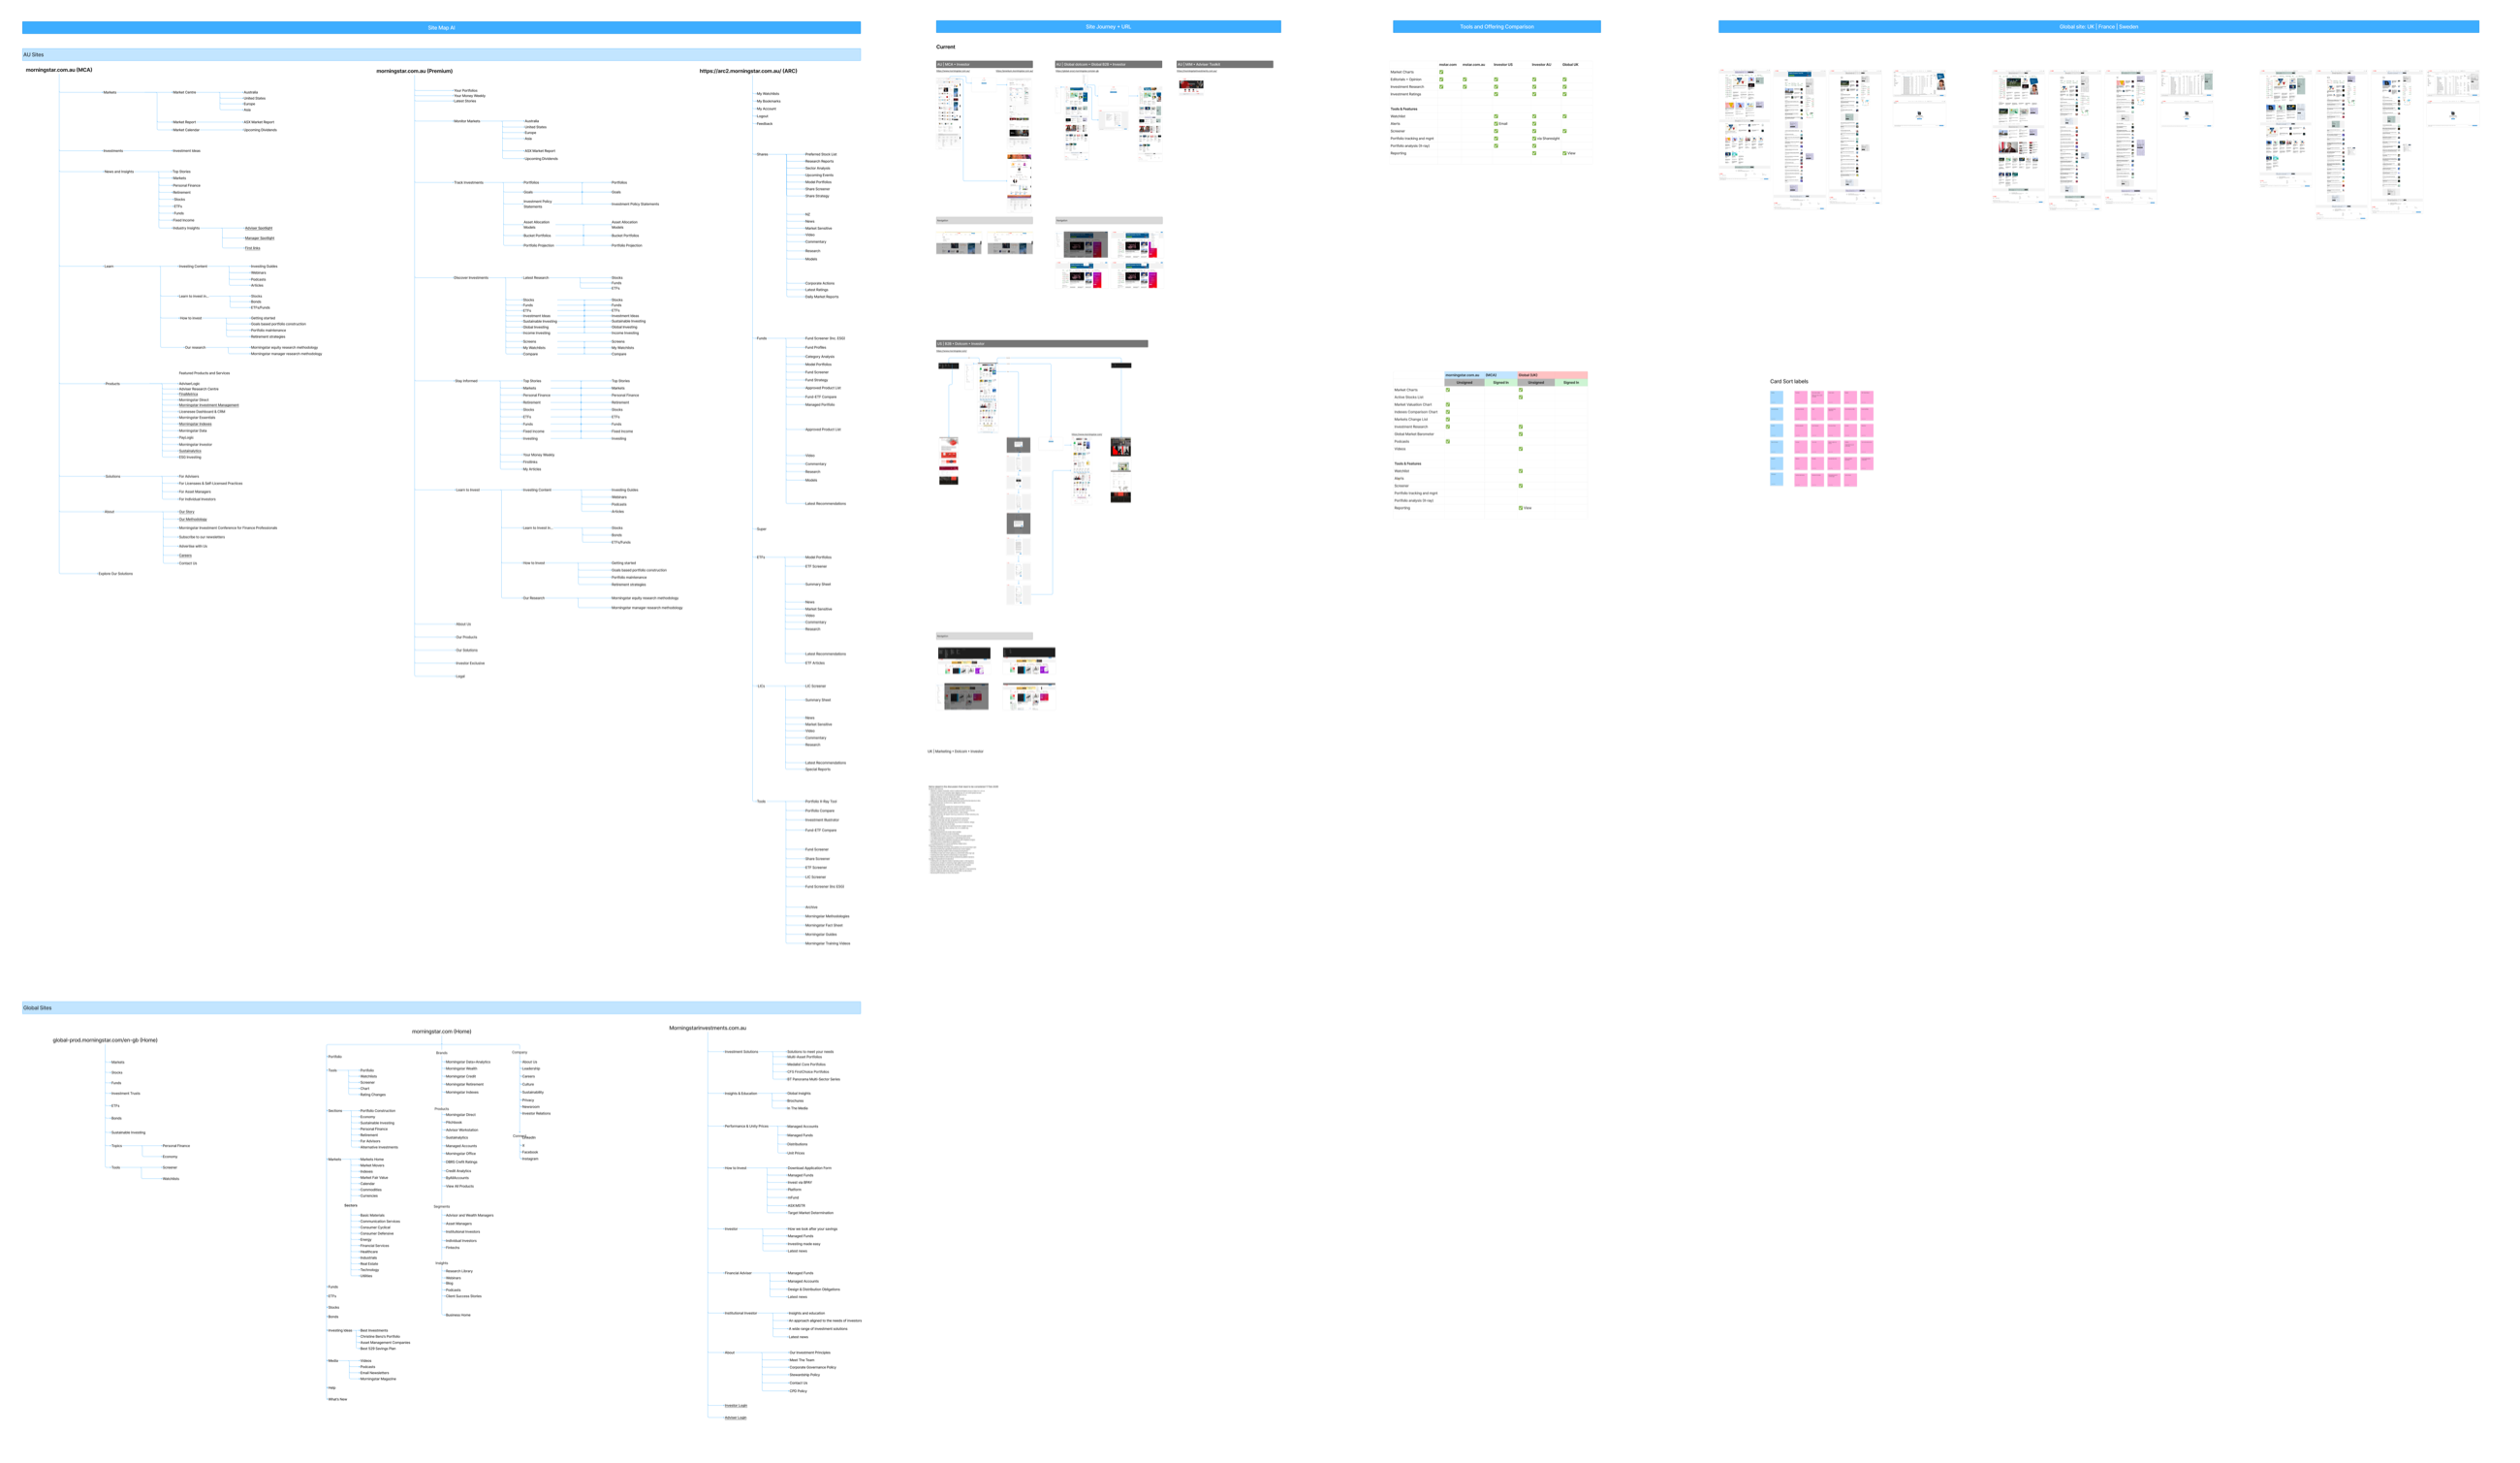
Three sites, three ways of organising the same things
Laid side by side, the three Australian sites turned out to be organised on three different principles, even though much of the content underneath is shared.
Public site · by topic
morningstar.com.au
- Markets
- Investments
- News and Insights
- Learn
- Products
- Solutions
Investor · by task
Premium
- Monitor Markets
- Track Investments
- Discover Investments
- Stay Informed
- Learn to Invest
Adviser · by asset class
ARC
- Shares
- Funds
- Super
- ETFs
- LICs
- Tools
Someone moving from the public site to a subscription, or from one product to the other, had to learn a new mental model each time. A unified platform needs one.
Where the tools actually live
I compared content and tools across five Morningstar sites and products. Editorial and research are everywhere. The tools are not.
| Capability | Morningstar.com | Morningstar.com.au | Investor US | Investor AU | Global UK |
|---|---|---|---|---|---|
| Content | |||||
| Market charts | ● | ○ | ○ | ○ | ○ |
| Editorial and opinion | ● | ● | ● | ● | ● |
| Investment research | ● | ● | ● | ● | ● |
| Investment ratings | ○ | ○ | ● | ● | ● |
| Tools and features | |||||
| Watchlist | ○ | ○ | ● | ● | ● |
| Alerts | ○ | ○ | ● | ○ | |
| Screener | ○ | ○ | ● | ● | ● |
| Portfolio tracking and management | ○ | ○ | ● | Via Sharesight | ○ |
| Portfolio analysis (X-ray) | ○ | ○ | ● | ● | ○ |
| Reporting | ○ | ○ | ○ | ● | View only |
- Content is the common ground: editorial and investment research appear on all five.
- The two public Morningstar sites have no tools at all. Tools sit inside the Investor products, and partly on the global UK site.
- Investor AU has the most complete toolset of the five, which makes it the natural core to build on.
How people move through it today
I mapped the current subscription flow for Australia and the global site, as swimlanes and then with real screens. In Australia the path to paid takes eight steps and ends on a different site. It also has no registered free member, which the global site does. That gap became the second level of the membership model.
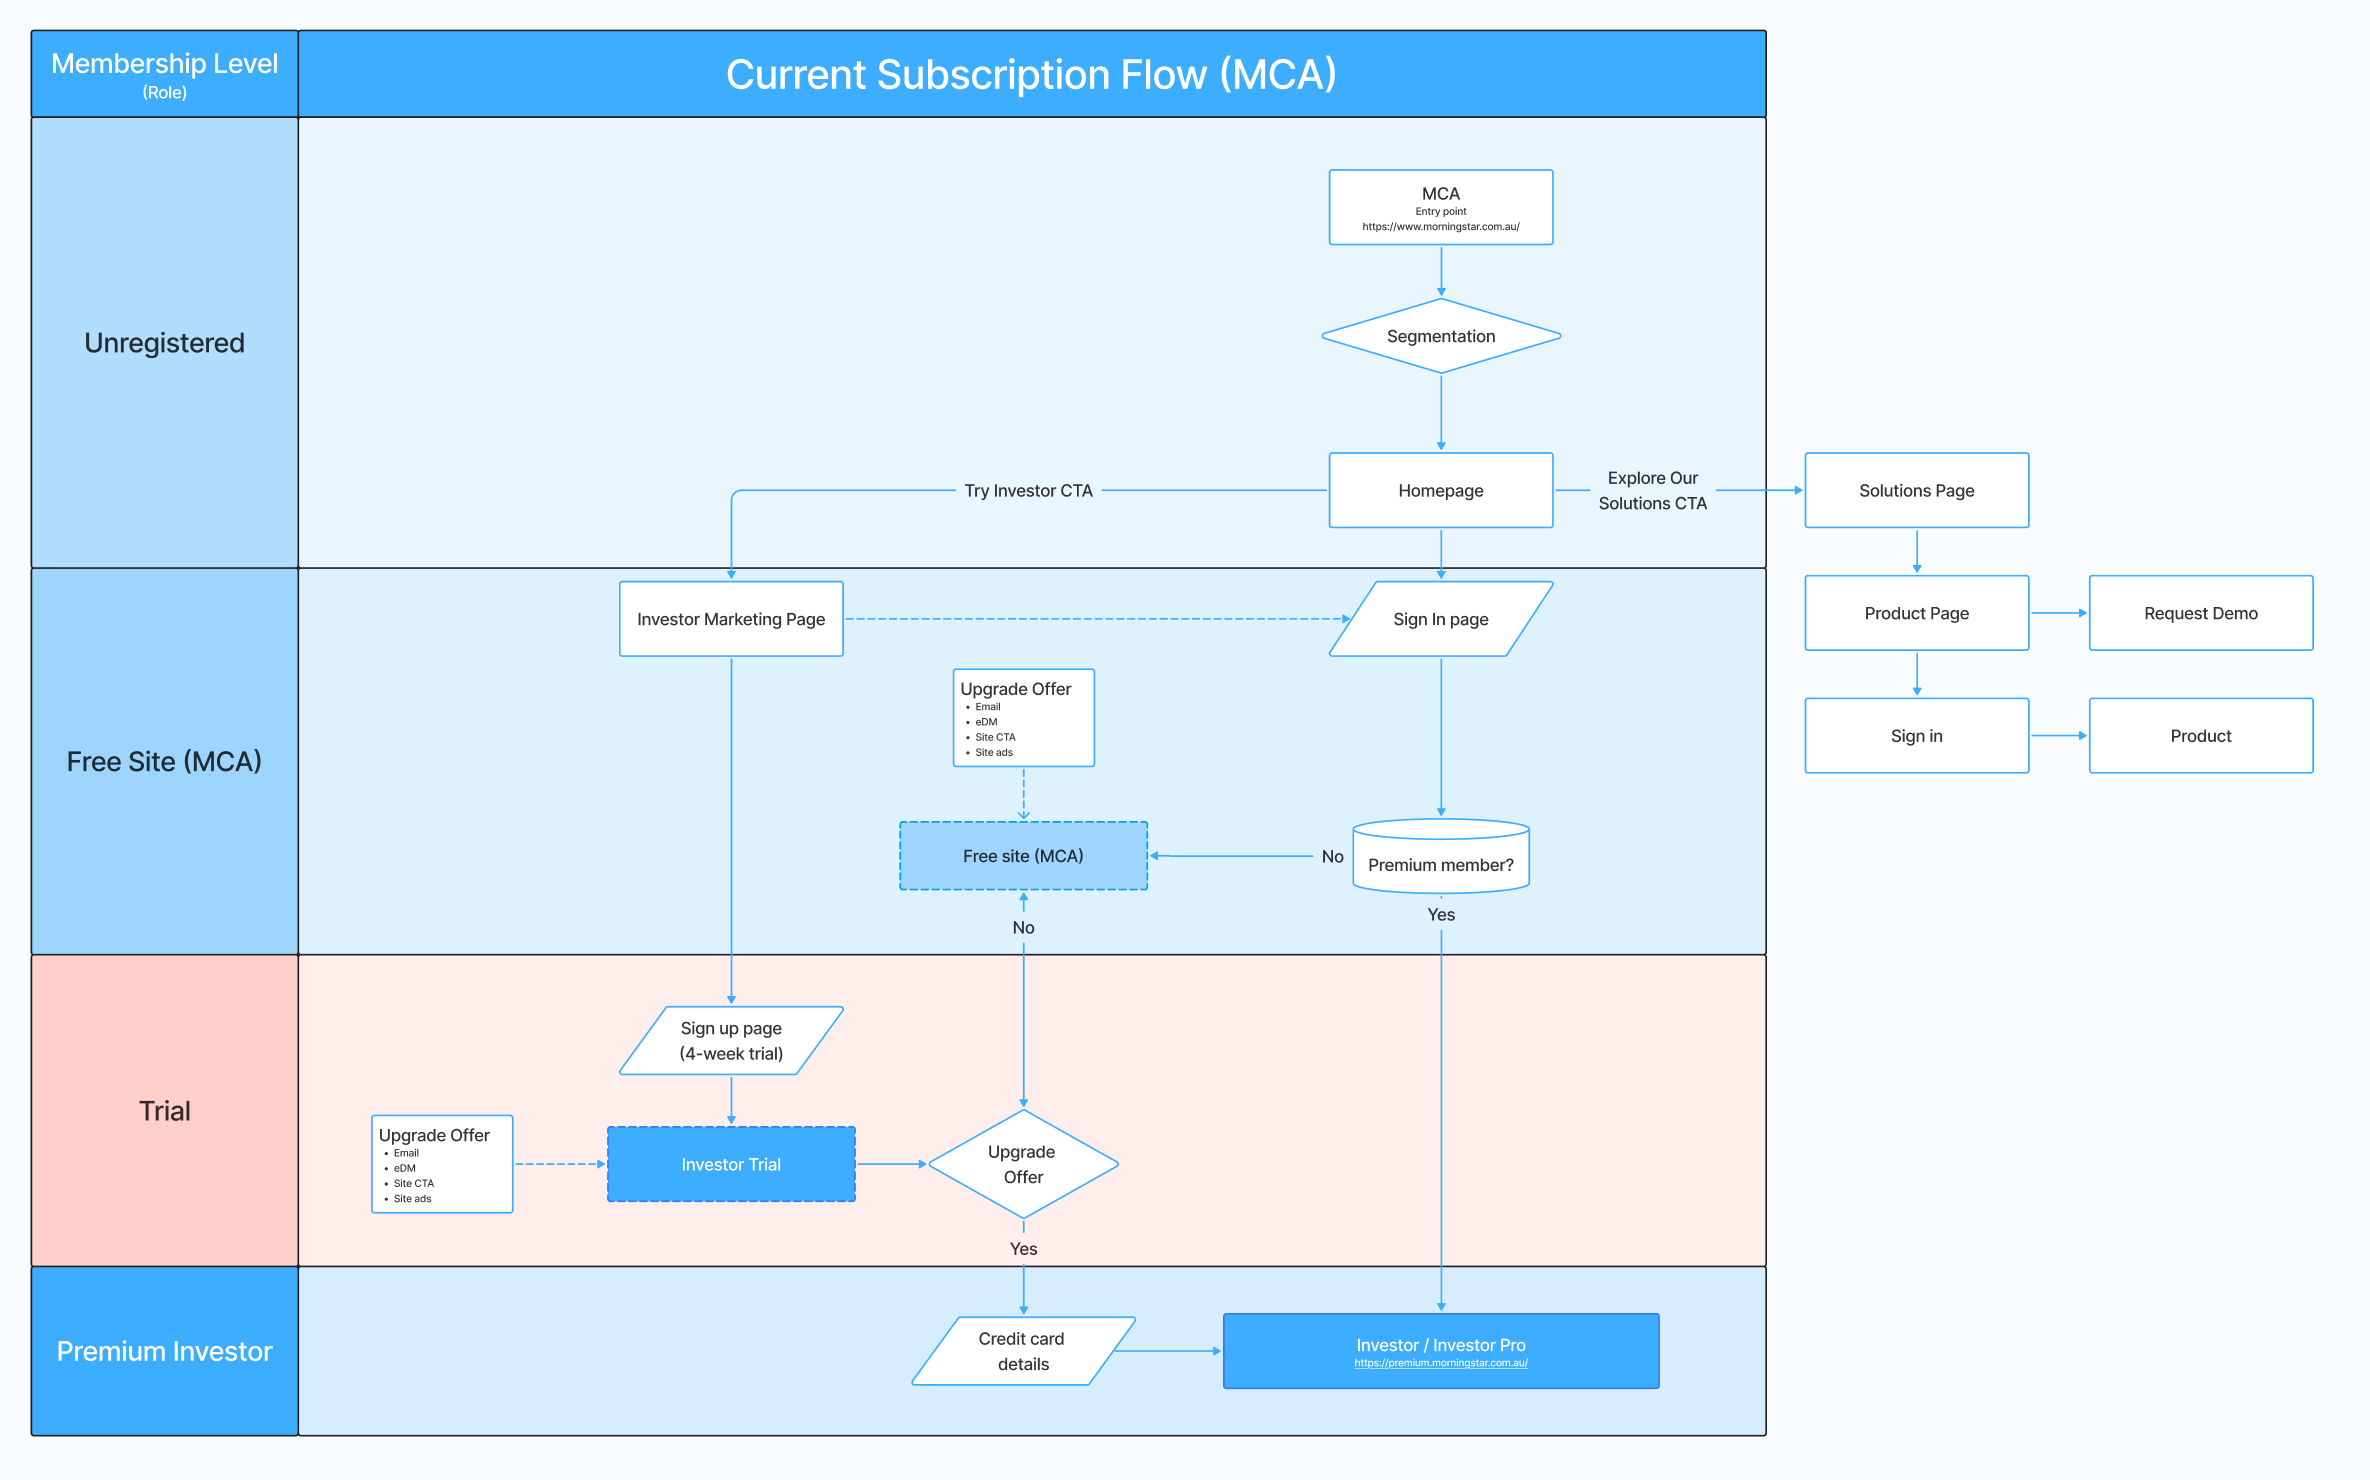


Questions the audit raised
- Where should free, public content live once the products are unified?
- How do we give people one login and one sign-up, instead of one per site?
- How do we avoid confusing free and premium experiences, and manage what each tier can access?
- How do we protect search visibility when sites move or merge?
04 · The market
Where Morningstar stands
I conducted capability and competitive analysis across research, data, editorial, investment, execution and membership experiences to identify opportunities for consolidation and differentiation.
Capabilities, side by side
The comparison put Morningstar Investor next to 30 other products an Australian investor might use instead, and scored each one across six areas: traffic, research, data, editorial and features, investment products and trade execution, and membership.
17
analysts, the most of the 31 products compared
4,800
securities under analyst research: 1,600 stocks, 3,000 funds and 200 ETFs
150k+
securities with data: 148,350 stocks, 3,061 funds and 362 ETFs

The best research, a fraction of the audience
Put the analyst numbers next to the traffic numbers and the real problem appears. The Motley Fool has 5 analysts and 2.2 million visits a month. Morningstar has 17 analysts and 338 thousand.
The quality of the research was never the issue. Too few people reach it. That is the case for the first two membership levels: give visitors and free members real value, so the research has an audience to convert.
One price, where others offer a range
Morningstar Investor has a single annual price. Most subscription competitors publish a range, with an entry point far below it.
- Morningstar Investor$675 a year
- The Motley Fool$299 to $1,499
- Investing.com$186 to $461
- Simply Wall St$168 to $336
- Market Index$30 to $588
Morningstar also offers no trade execution or investment products. That is a boundary, not a gap: the platform is for research, and trading is the brokers' territory. Pricing is the opening, and it is the one the membership levels are designed to fill.
The competitor landscape
We mapped 27 players on two axes: from broker platforms to research and insights, and from news and editorial to tools and data. It covers everywhere an investor might go instead: a broker, a newspaper, a data site, a research service.
What the map shows
- Morningstar sits where research and insights meet tools and data, the most crowded part of the map, with 11 of the 27 players.
- It is the only one marked as both a product provider and serving advisers and investors. Serving both audiences is the difference, which is what a unified platform builds on.
- News and editorial sites sit at the top of the map. That is where a new investor's journey tends to start, before they ever reach a research product.
- Broker platforms serve both markets too, from the opposite side: they start from execution, not research.
Where Investor stood
The analysis started with an honest look at the Investor product: what it already did well, where it fell short, and where the market was moving.
Strengths
- Analyst research and exclusive reports
- Extensive tools and features
- Sharesight portfolio manager
- Personal finance editorial offering
- Sponsorships and advertising
Weaknesses
- Product communication and positioning to the market
- Landing page lacks product promotion
- Excessive provision of free material
- Poor UI
Opportunities
- Surface the value proposition on the public site
- Tiered pricing structure with control and limitation
- Partnerships with third parties
- Enhanced UI and UX
- Redefine the product proposition
Threats
- Competitor offerings are superior in key areas
- Competitors' software focus enables fast-paced improvements and new feature rollout
From weakness to opportunity
Read side by side, the weaknesses and opportunities pair up, and each pair points at design work.
- Poor UI→ Enhanced UI and UX on a shared foundation
- Too much given away for free→ A tiered structure with control and limitation
- Weak positioning and product promotion→ A redefined proposition, surfaced where visitors arrive
05 · The users
Who we were designing for
In a personas and packaging workshop we sorted the audience into five groups, from people who read for free to professionals using the research inside planning software. The professional groups want what a self-directed investor wants, for many other people. So the board asks: should they be combined?

- 01The readerB2CTakes what is free. Editorial written for non-professionals.
- 02The self-directed investorB2CInvests for themselves. Wants the best ideas, and to act in their own time.
- 03The professionalB2C + B2BThe same needs, for many other people. Wants to show the reasons behind an investment.
- 04The professional, globalB2C + B2BThe professional group, plus overseas offerings.
- 05The planning-software userB2BUses the research inside financial planning software, as a package or an integration.
The two ends of the range: new investors and advisers
New investors
"How do I do it?"
Their journey starts outside the product: a search engine, an AI chatbot, the news, a friend or family member. They compare and screen stocks, question what to invest in, and often can't decide.
Advisers
Advice they can stand behind
They work through compliance red tape to give good advice, need proof to respond to complaints about that advice, and need research they can trust.
What users told us
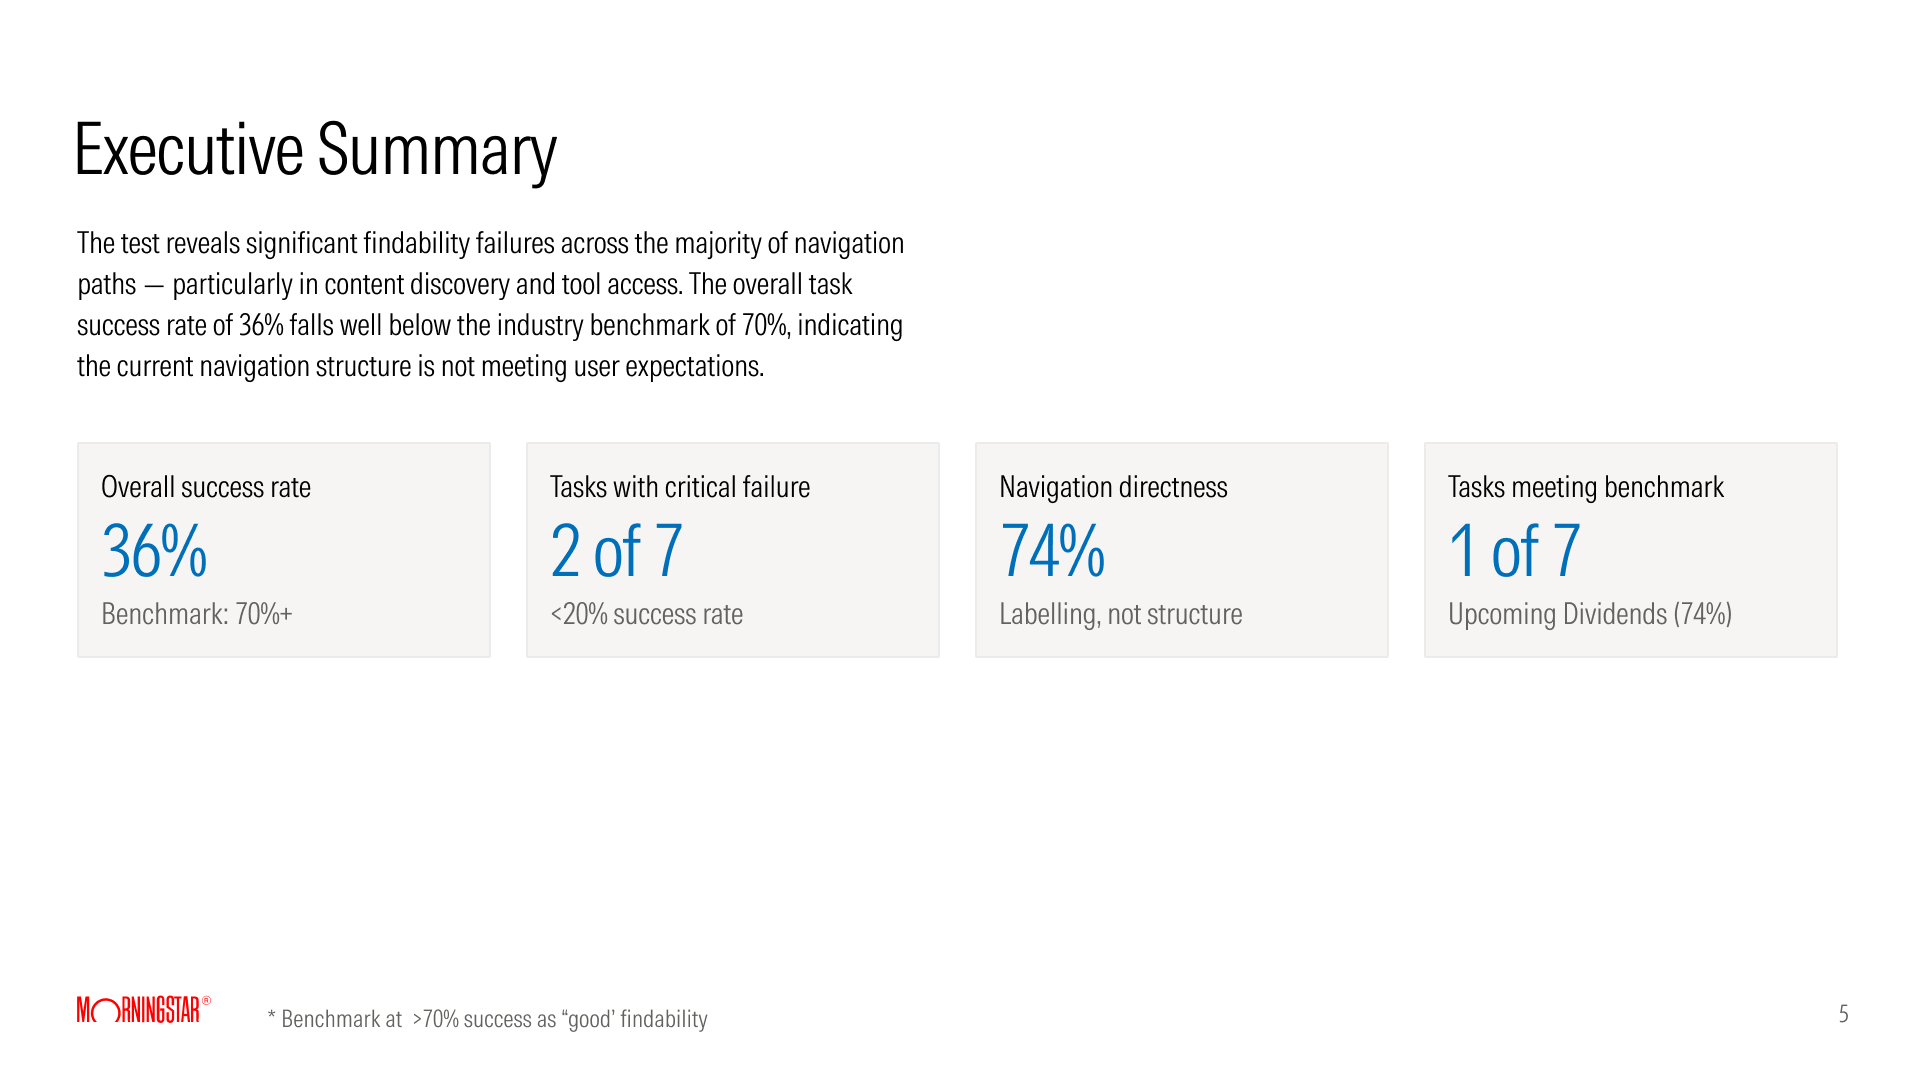
The audit showed how the sites were organised. Research showed how people expect them to be organised. I ran two studies: a navigation test, to measure how well people can find things, and a card sort, to learn how investors and advisers group content.
Study one: navigation testing
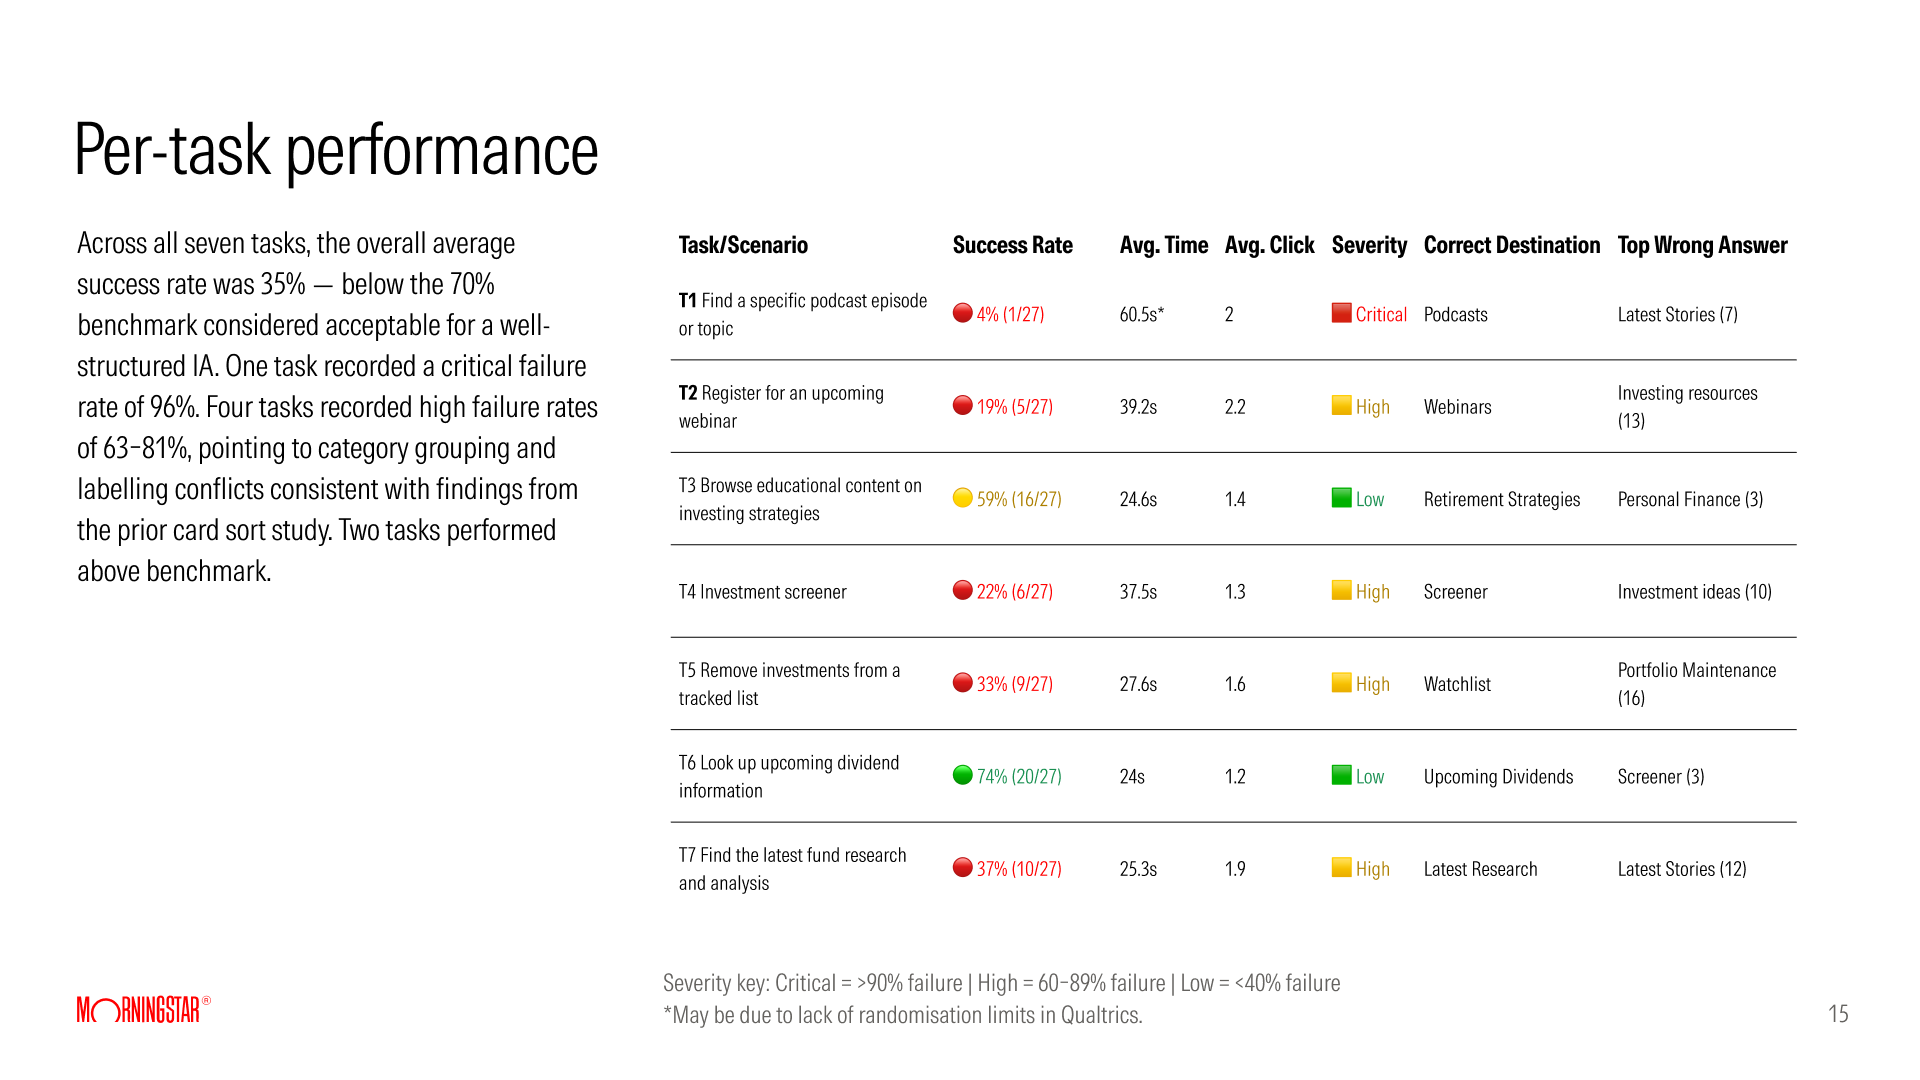
27 investors were given seven realistic tasks and asked where in the navigation they would go. They worked on their own, with nothing but the menu labels to guide them.
36%
overall task success, against a 70% benchmark
74%
directness: people went straight to their answer
1 of 7
tasks met the benchmark
People navigated with confidence, but to the wrong place. It is a labelling problem, not a structure problem. The key finding
Study two: the card sort
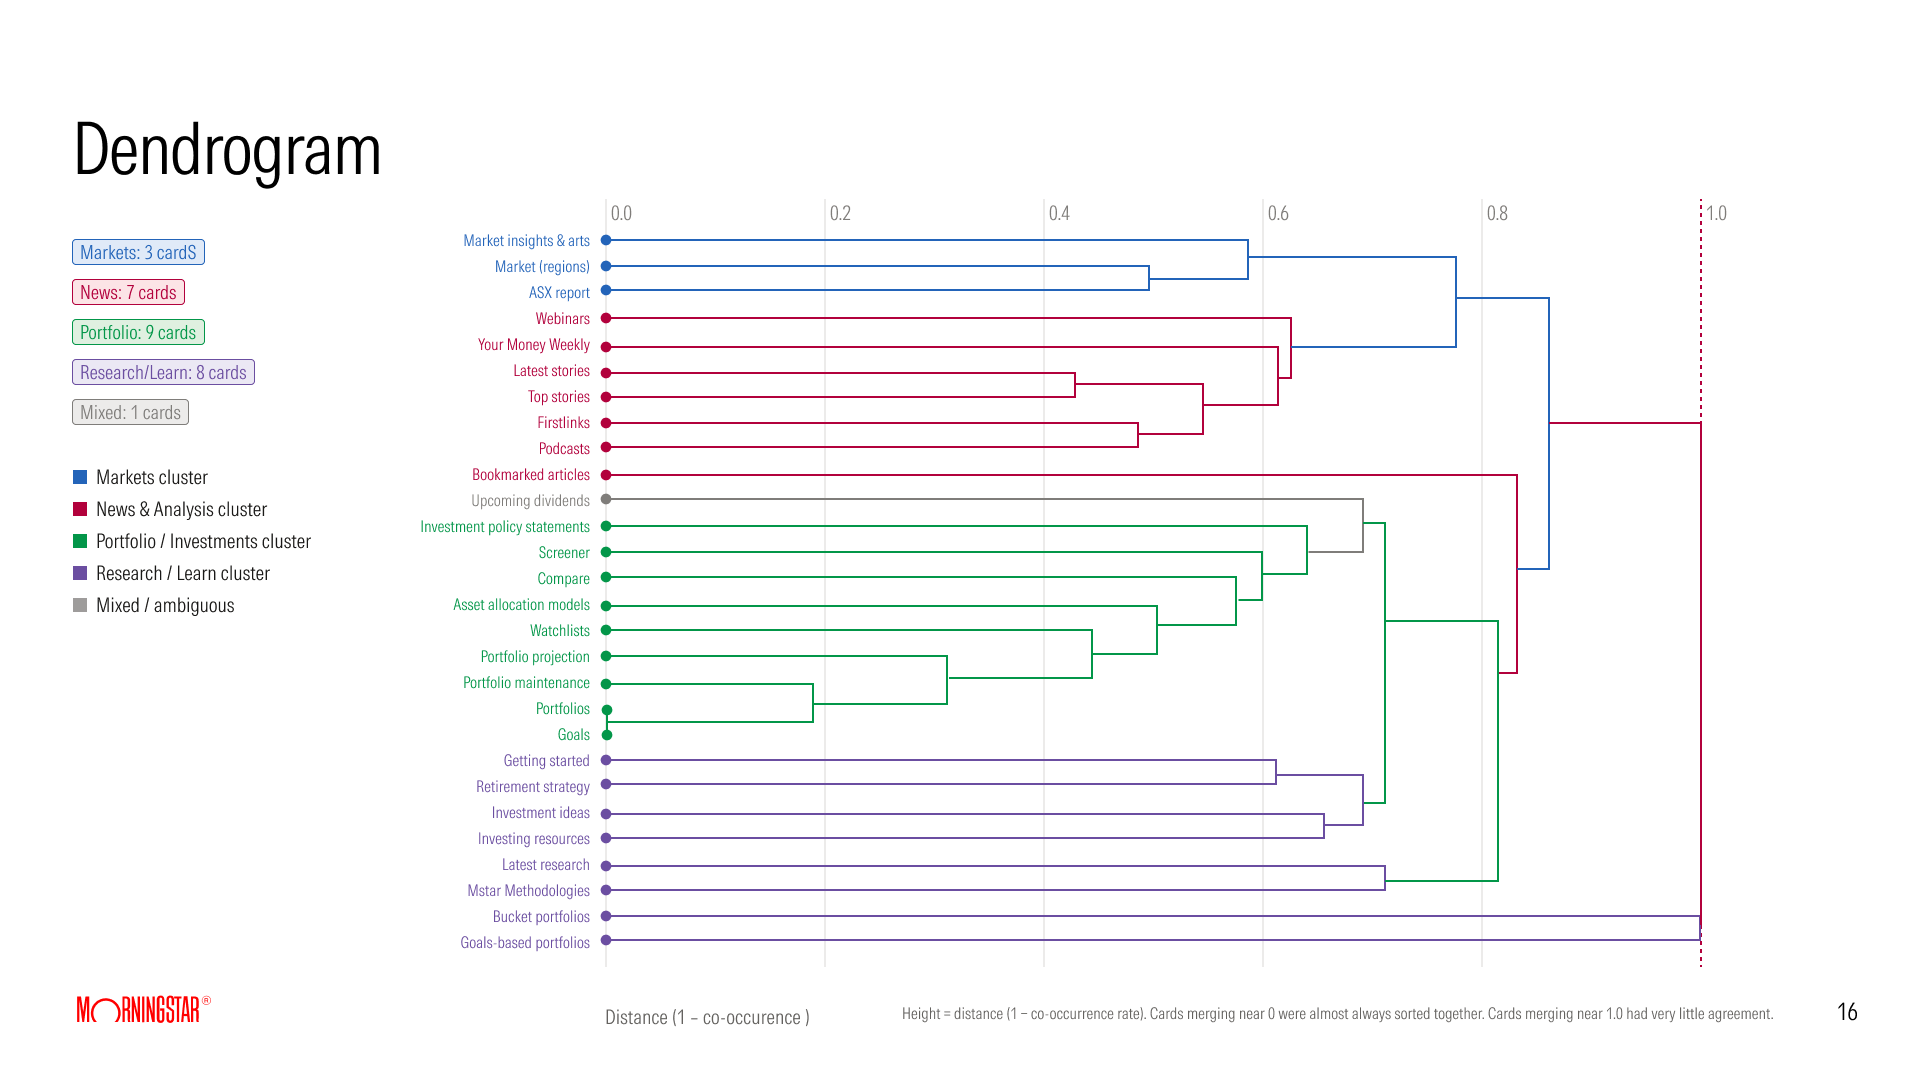
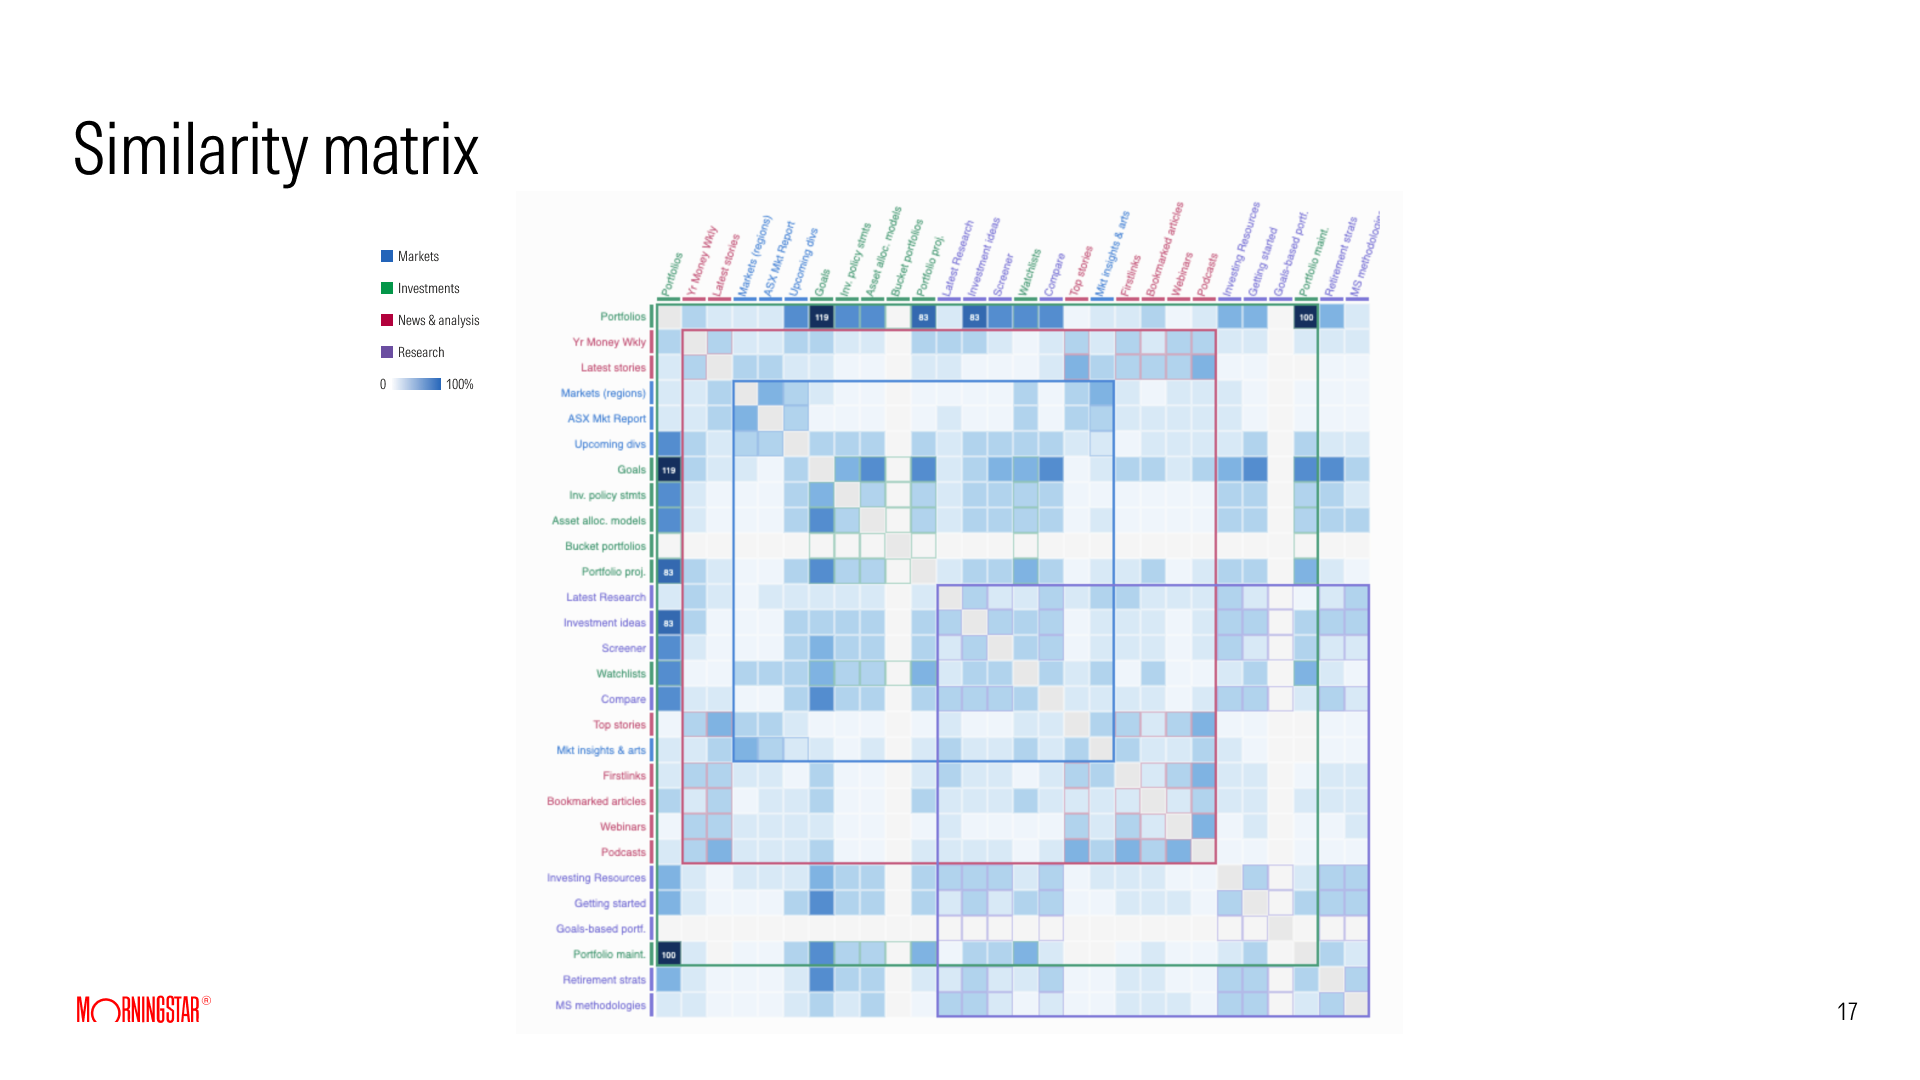
Investors and advisers sorted the same 28 cards into categories, so we could compare how each group thinks. Every card was a real label from the sites I had audited, such as "Screener", "Watchlists" and "Your Money Weekly", so people were sorting the words they actually see. One question sat behind the study: does a platform for both audiences need role-based navigation?
36
investors completed the card sort
5
financial advisers, a small sample, so directional only
28
cards, sorted into 5 categories or their own
01
Markets is the most stable category
Both groups placed Markets content consistently and without ambiguity.
02
Investments versus Research is the core problem
Both groups described the same confusion, independently and in their own words.
03
A Learn category emerged unprompted
People in both groups asked for a dedicated education space without being offered one.
04
Two different mental models
Advisers are research-first and think in professional workflows. Investors are news-first and think in content types.
06 · The risks
Risks & premortem
Before committing to the plan, we ran a premortem. The premise: the unified platform has launched, and it has failed. What went wrong? Everyone wrote down their reasons, we grouped them into themes, and the team voted on the ones that worried them most.
36
ways the project could fail, raised by the team
3
themes they grouped into
38
votes cast to find the biggest worries

Three themes
15 notes
Adapting to the market
Tiers that aren't different enough. Taking too long to reach the market. Subscribers worn out by migration. A competitor launching something that makes us obsolete.
10 notes
Tooling and product value
Advisers without enough pro tooling, feeling undervalued in a tool shared with investors. Investors overwhelmed. Unclear value, and free-trial users who never convert.
11 notes
Development and integration
Teams building in silos. Requirements that keep changing. Chasing feature parity instead of being better. Trying to build everything for everyone.
What worried the team most
- Tier differences are not strong enough4 votes
- Speed to market is too slow3 votes
- No ongoing conversation with current clients about the benefits and disruption of the change3 votes
- Advisers don't get enough pro tooling3 votes
- Users don't see the added value once AI is doing the work3 votes
- Requirements keep changing and the architecture isn't planned for it3 votes
Six areas of risk
I framed what came out of the premortem as user and business risks across six areas.
- MigrationAudience drops during migration, and subscribers tire of change
- AdoptionFree-trial confusion, and users who never convert
- Tier valueTiers too similar; throttling pushes basic users away
- Technical constraintsSiloed builds, and packaging that must stay flexible as strategy changes
- Competitive positioningCompetitors launch a new experience first
- Natural-language interactionPeople expect to ask, not navigate, and to read summaries, not articles
The risk that reaches furthest
Two notes described the same future. If development takes too long, people will have become used to asking AI in plain language instead of operating tools themselves: no navigation, and summaries instead of articles. That risk is reflected later in the experience vision, where AI is an embedded layer across the product rather than a feature.
How the top risks changed the plan
The premortem did not stay on the board. Each of the risks the team voted highest changed something in the design.
- Tiers not different enoughEvery level got its own purpose, its own primary measure and its own wording. The plans page describes each plan as "everything in the one before, plus", and the product says no in four clear ways, so the difference between levels is visible on every screen.
- Advisers without enough pro toolingPro and Enterprise became levels in their own right, framed around the advice process: approved product lists, draft and published states, shared lists across a practice, and the same analysis inside the planning software advisers already use.
- Clients left in the dark during migrationA soft transition for existing adviser users became a stated goal. The design's part was to make the change feel small: one navigation, one look, and a free level so that nobody is dropped when a trial ends. The communication plan itself sat with the business.
- Speed to market, and requirements that keep changingOne component library behind every screen, with levels set by configuration. A change in packaging becomes a change in settings, not a redesign.
- Not seeing the value once AI does the workAI was planned as a layer that grows with the level, from a utility for free members to a co-pilot for Premium and a strategic partner for Pro, so its value is tied to what each level is for.
Charting the course
The premortem told us how the project could fail. To turn that into a plan, we put everything on one picture using the sailboat exercise: the island is the goal, the anchor is what slows us down, the rocks are risks on the horizon, and the sun is the opportunity. The question at the top of the board: what helps us ship one product across three tiers?

A clean, unified experience where both investors and advisers feel "this is built for me." The goal, from the board
The island
Goal
Reduce friction across the learn → research → build → analyse workflow for every user. A versatile platform for both audiences that doesn't devalue either, and a soft transition for existing ARC users.
The sun
Opportunity
AI workflows, journeys, summaries and ratings outputs, layered into the overall product and experience.
The rocks
Risks on the horizon
Paid doesn't feel valuable once you sign in. Free tools turn out better than paid ones. The paid experience looks and feels different. Current users are disrupted, and the downgrade path is unclear.
The anchor
What slows us down
The risks from the premortem, plus three new ones: day-to-day operational drag, a scope that isn't clearly defined, and dependence on the global site.
What it changed for design
- Define what the product will be and, just as importantly, what it won't be.
- Make the paid experience visibly better than the free one, in tools and in look and feel.
- Design so that neither audience feels the product was built for someone else.
- Build it modular and scalable, so it blends with the global site.
- Design the ways out as carefully as the ways in: migration for ARC users, and downgrading.
07 · Strategy
From evidence to decisions
Four kinds of evidence (the product, the market, the users and the risks) each pointed at a decision. This is the thread that runs through everything that follows.
| Source | What we found | What we decided |
|---|---|---|
| Audit | Three sites organise the same content in three different ways: by topic, by task and by asset class. | One navigation for everyone, built from how users group things. |
| Flow mapping | Australia has no registered free member. People are anonymous, on a trial, or paying. | A free member level. Register once and keep the account, whether or not you pay. |
| Navigation test | 74% of people go straight to an answer, but only 36% get it right. They are confident and wrong. | Keep the structure. Rewrite the labels in the user's language. |
| Market | 17 analysts, the most of 31 products, but a fraction of competitors' traffic and a single price. | Membership levels instead of one price, with depth that grows with the user. |
| Card sort | Advisers are research-first. Investors are news-first. | One shared foundation with role-based depth. Role-based navigation stays an open question until more advisers are tested. |
| Premortem | The team's top worry: the tiers won't feel different enough. | Every tier gets its own design objectives and its own measure of success. |
One product, five levels
One product serves different user types through access levels, and the first version from the workshop read Free trial → Investor → Adviser.
As the evidence came in, the levels settled into visitor, free member and paid member, with the paid level offered at two depths: Premium and Pro. The designs add Enterprise on top, for advice practices that manage Pro access and product lists for their advisers.
01
One product
A single platform instead of separate products for each audience.
02
Five levels
Visitor, Free, Premium, Pro and Enterprise.
03
One shared UX foundation
The same core experience for everyone.
04
Role-based depth & features
What changes between tiers is depth, not the product.
Before: three separate platforms
After: one product, five levels
One shared UX foundation: Screener · Watchlist · Compare · Portfolio X-ray
A day in the life, by tier
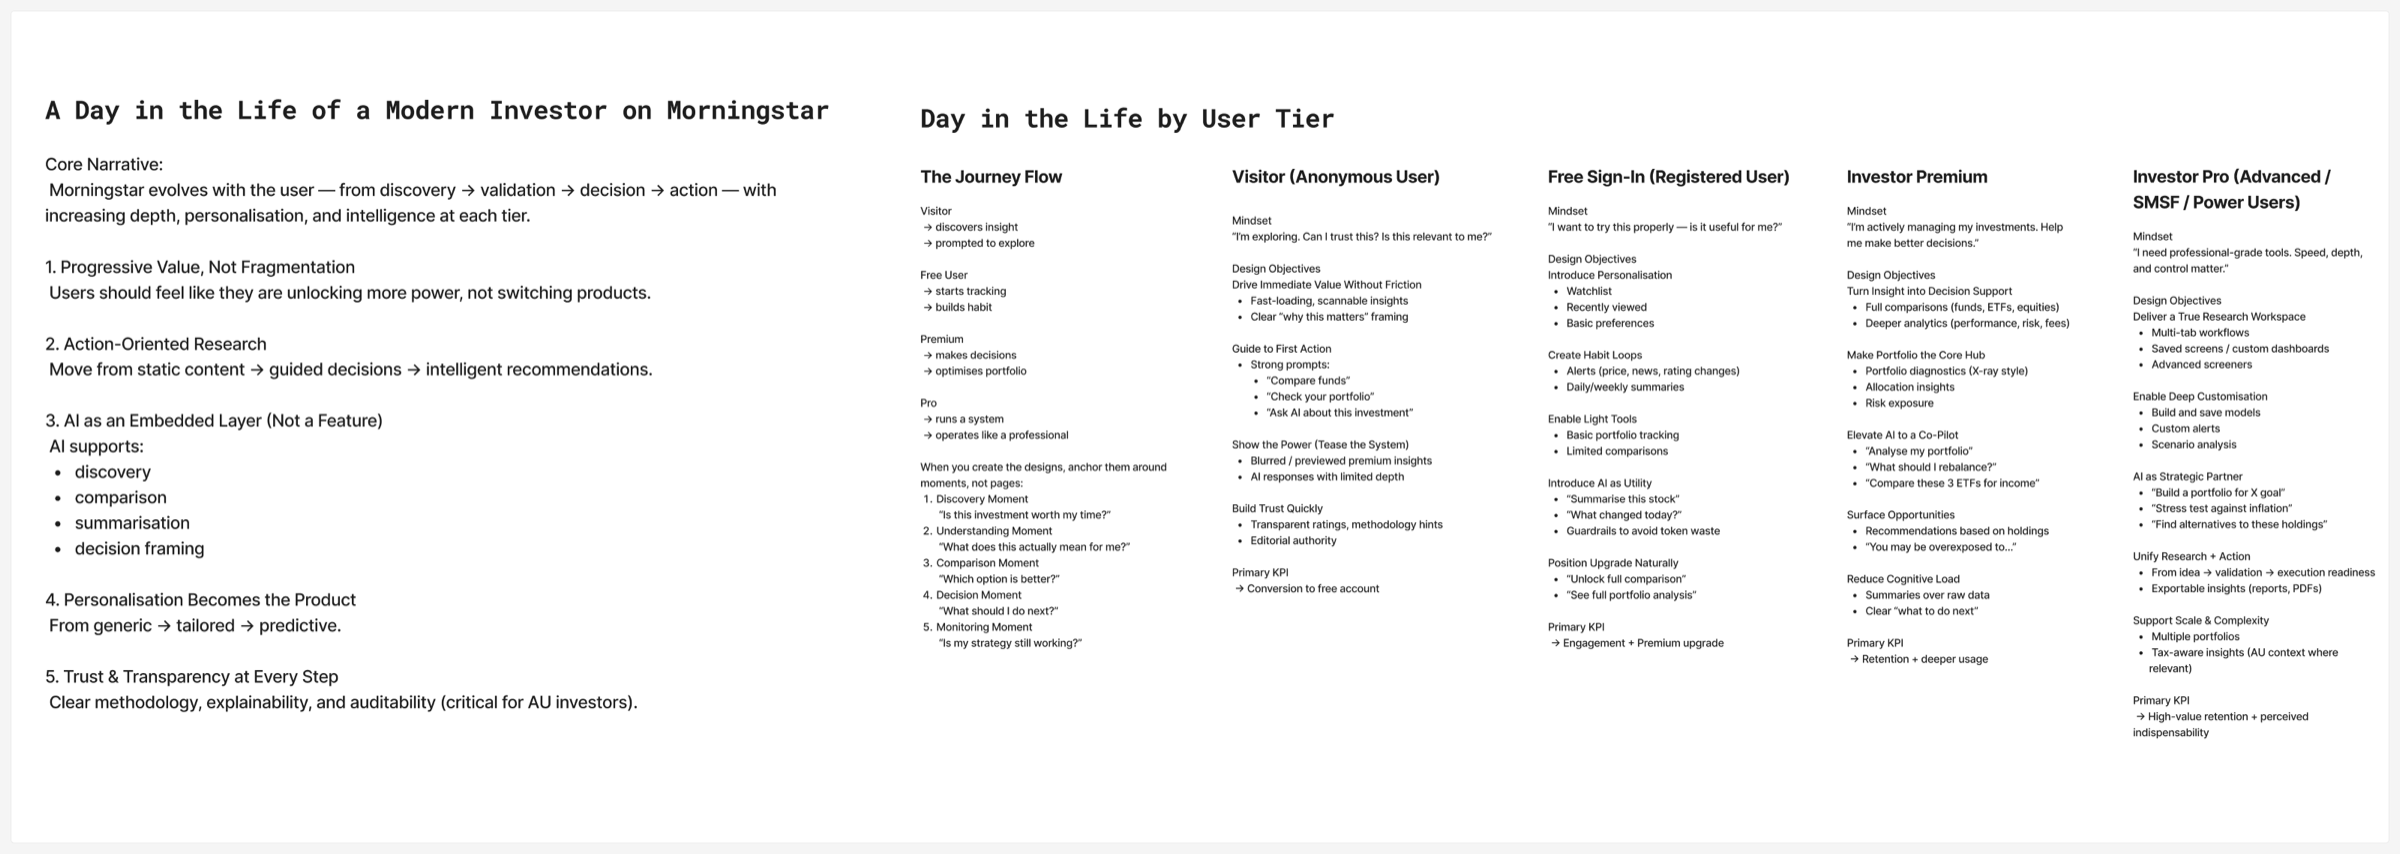
"One product, five levels" is a business model. To turn it into an experience, we described a day in the life of a modern investor at each tier: what they are thinking, what the design has to do for them, and how we would know it worked.
Core narrative
The product evolves with the user, from discovery to validation to decision to action, with increasing depth, personalisation and intelligence at each tier.
Five principles
01
Progressive value, not fragmentation
Users should feel like they are unlocking more power, not switching products.
02
Action-oriented research
Move from static content, to guided decisions, to intelligent recommendations.
03
AI as an embedded layer, not a feature
AI supports discovery, comparison, summarisation and decision framing.
04
Personalisation becomes the product
From generic, to tailored, to predictive.
05
Trust and transparency at every step
Clear methodology, explainability and auditability, which are critical for Australian investors.
The journey by tier
Each tier starts from a different mindset, so each has its own design objectives and its own measure of success.
Visitor
Anonymous user
"I'm exploring. Can I trust this? Is this relevant to me?"
Discovers insight → prompted to explore
- Drive immediate value without friction
- Guide to a first action
- Show the power of the full product
- Build trust quickly
Primary KPIConversion to free account
Free
Registered user
"I want to try this properly. Is it useful for me?"
Starts tracking → builds a habit
- Introduce personalisation
- Create habit loops
- Enable light tools
- Introduce AI as a utility
- Position the upgrade naturally
Primary KPIEngagement and Premium upgrade
Premium
Active investor
"I'm actively managing my investments. Help me make better decisions."
Makes decisions → optimises portfolio
- Turn insight into decision support
- Make the portfolio the core hub
- Elevate AI to a co-pilot
- Surface opportunities
- Reduce cognitive load
Primary KPIRetention and deeper usage
Pro
Advanced · SMSF · power users
"I need professional-grade tools. Speed, depth and control matter."
Runs a system → operates like a professional
- Deliver a true research workspace
- Enable deep customisation
- Make AI a strategic partner
- Unify research and action
- Support scale and complexity
Primary KPIHigh-value retention
AI grows with the user
AI is not one feature switched on at a price point. It starts as a utility for free users ("Summarise this stock"), becomes a co-pilot for Premium investors ("What should I rebalance?"), and a strategic partner for Pro ("Stress test against inflation").
Moments, not pages
We anchored the designs around five moments in an investor's decision, rather than around pages.
- 1Discovery"Is this investment worth my time?"
- 2Understanding"What does this actually mean for me?"
- 3Comparison"Which option is better?"
- 4Decision"What should I do next?"
- 5Monitoring"Is my strategy still working?"
One navigation: the proposed structure
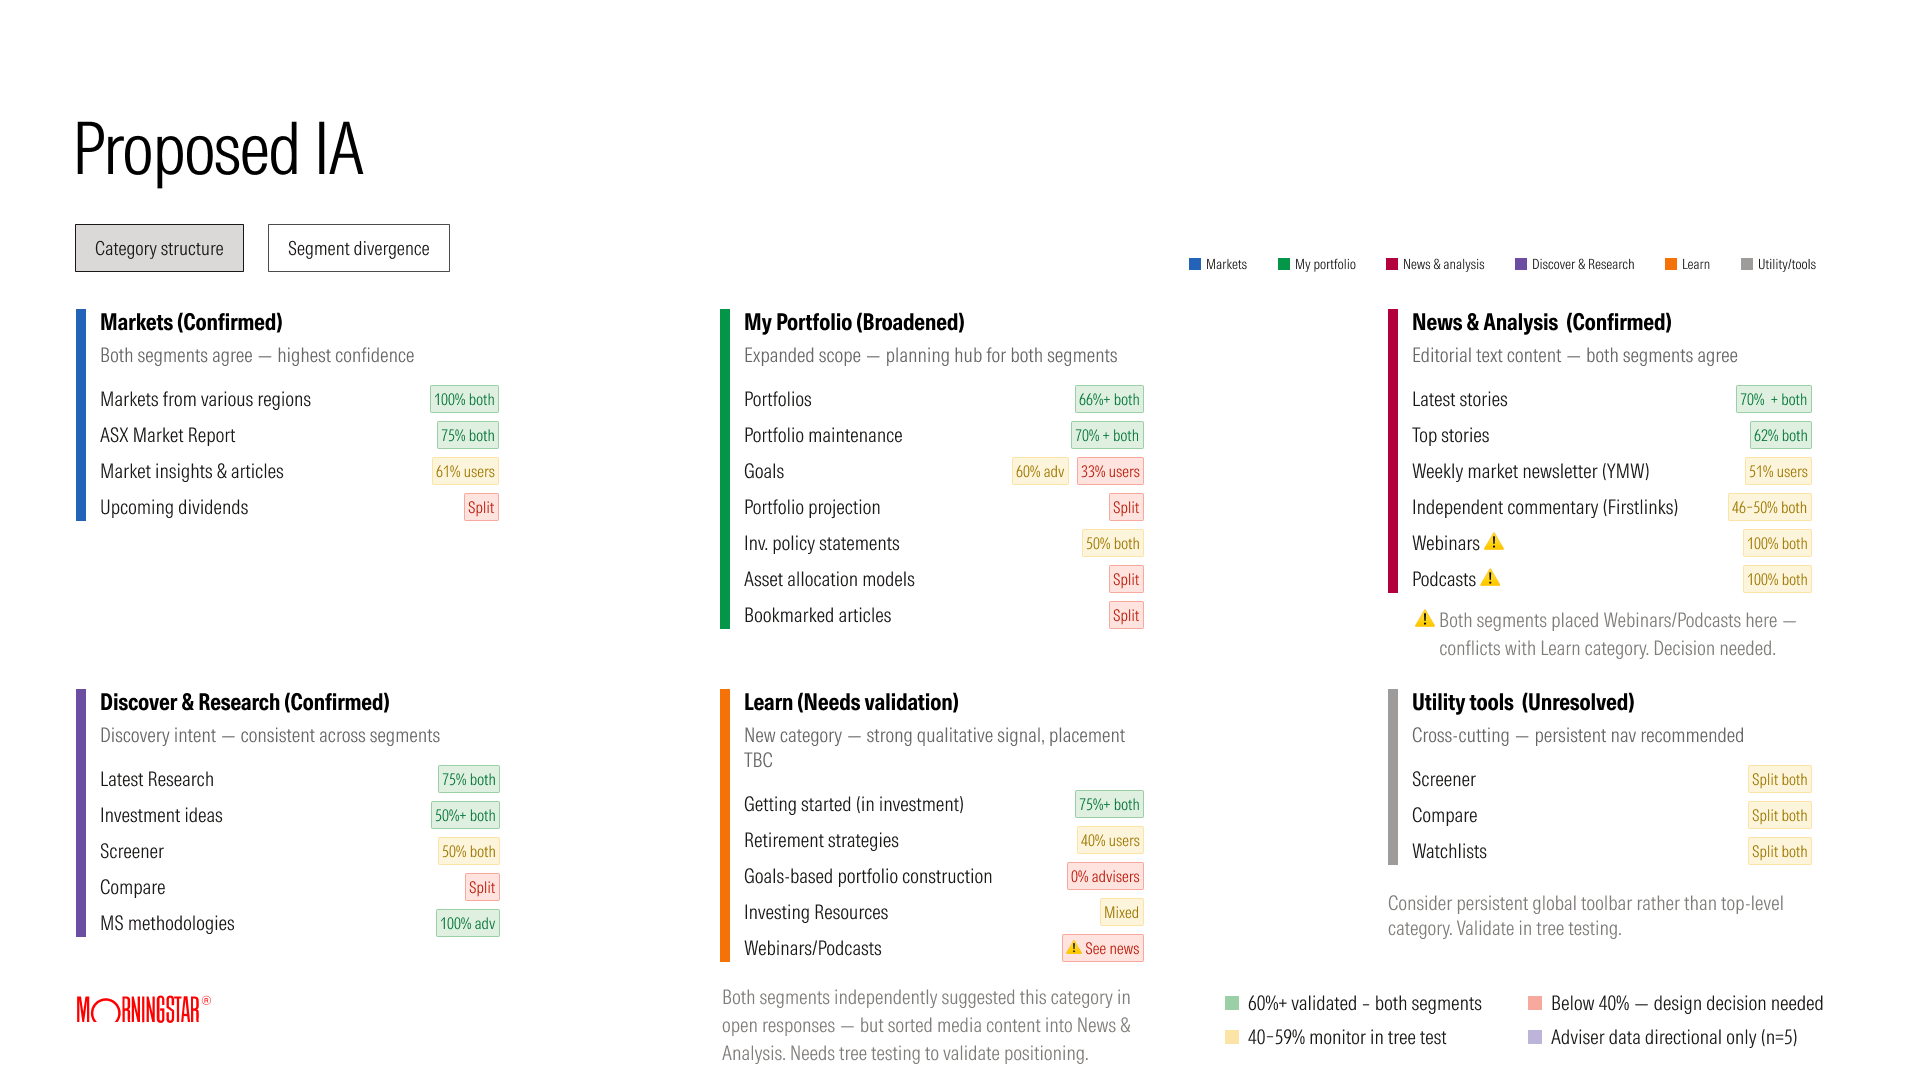
Together the studies pointed to six categories, each with a level of confidence from the data.
- MarketsConfirmed: both groups agree, highest confidence
- My PortfolioBroadened: a planning hub for both groups
- News & AnalysisConfirmed: editorial content
- Discover & ResearchConfirmed: consistent across groups
- LearnNew: needs validation
- Utility toolsUnresolved: Screener, Compare and Watchlists may work better as a persistent toolbar
What it means for the design
- Write labels in the user's language. "Upcoming dividends" worked because it says exactly what it is.
- Keep the structure; fix the names and the groupings.
- Separate things people confuse: watchlist from portfolio, research from news, live events from learning resources.
- Treat role-based navigation as an open question. Advisers and investors think differently, but five advisers is too few to decide on.
What the findings changed in the screens
The proposed structure became the navigation that every screen in the design chapter is built on. Six things carried across directly.
- Tools got their own placeWatchlist and Screener are top-level items in the side navigation, separate from Portfolio. That answers the study's most concentrated confusion, watchlist against portfolio maintenance, and settles the open question of where utility tools live.
- Labels say what they doThe screener page is titled "Investment Screener" and the compare tool "Investment Compare", so the name describes the action. "Upcoming dividends", the one label that met the benchmark, was kept exactly as it was.
- Research separated from newsResearch is its own navigation item. Editorial lives on Home under content tabs such as Top stories, Markets and Personal Finance, so analyst research and news are never side by side under one label.
- A fixed place to learnBoth groups asked for a Learn category without being offered one. The Knowledge Centre sits at the bottom of every navigation panel, with Learn to invest, Our methodology and Help.
- Markets left aloneThe most stable category in the study stayed a top-level item, unchanged.
- One navigation, not one per roleWith only five advisers tested, I did not build role-based navigation. Instead the More menu groups what each plan unlocks, and the page copy changes by level, so the same structure reads differently to an investor and an adviser.
Objective & key results
Objective
Deliver a more consistent and cohesive research experience across platforms for both advisers and investors, improving how users access insights, conduct research and manage portfolios.
The objective was tied to five key results, measured in the order they were expected to move: operational complexity first, then the user outcomes that follow from a better product. The target across them was double-digit growth in subscriptions and revenue.
- KR1Reduce operational complexityThree platforms consolidated into one, with fewer duplicate features and systems to run
- KR2Increase engagement across research journeysSession depth and feature usage, from reading to screening to portfolio tools
- KR3Improve retentionReturning users and subscription renewal rate
- KR4Increase conversion to paid plansVisitors to free members, and free members to Premium and Pro
- KR5Reduce drop-off in key workflowsFewer people abandoning sign-up, screening and portfolio set-up part way through
How each level would be judged
Each membership level also carried one primary measure, so the team could see where the product was working and where it was not.
- VisitorConversion to a free account
- FreeEngagement, and upgrade to Premium
- PremiumRetention and deeper usage
- Pro and EnterpriseHigh-value retention
08 · Design
A new path to membership
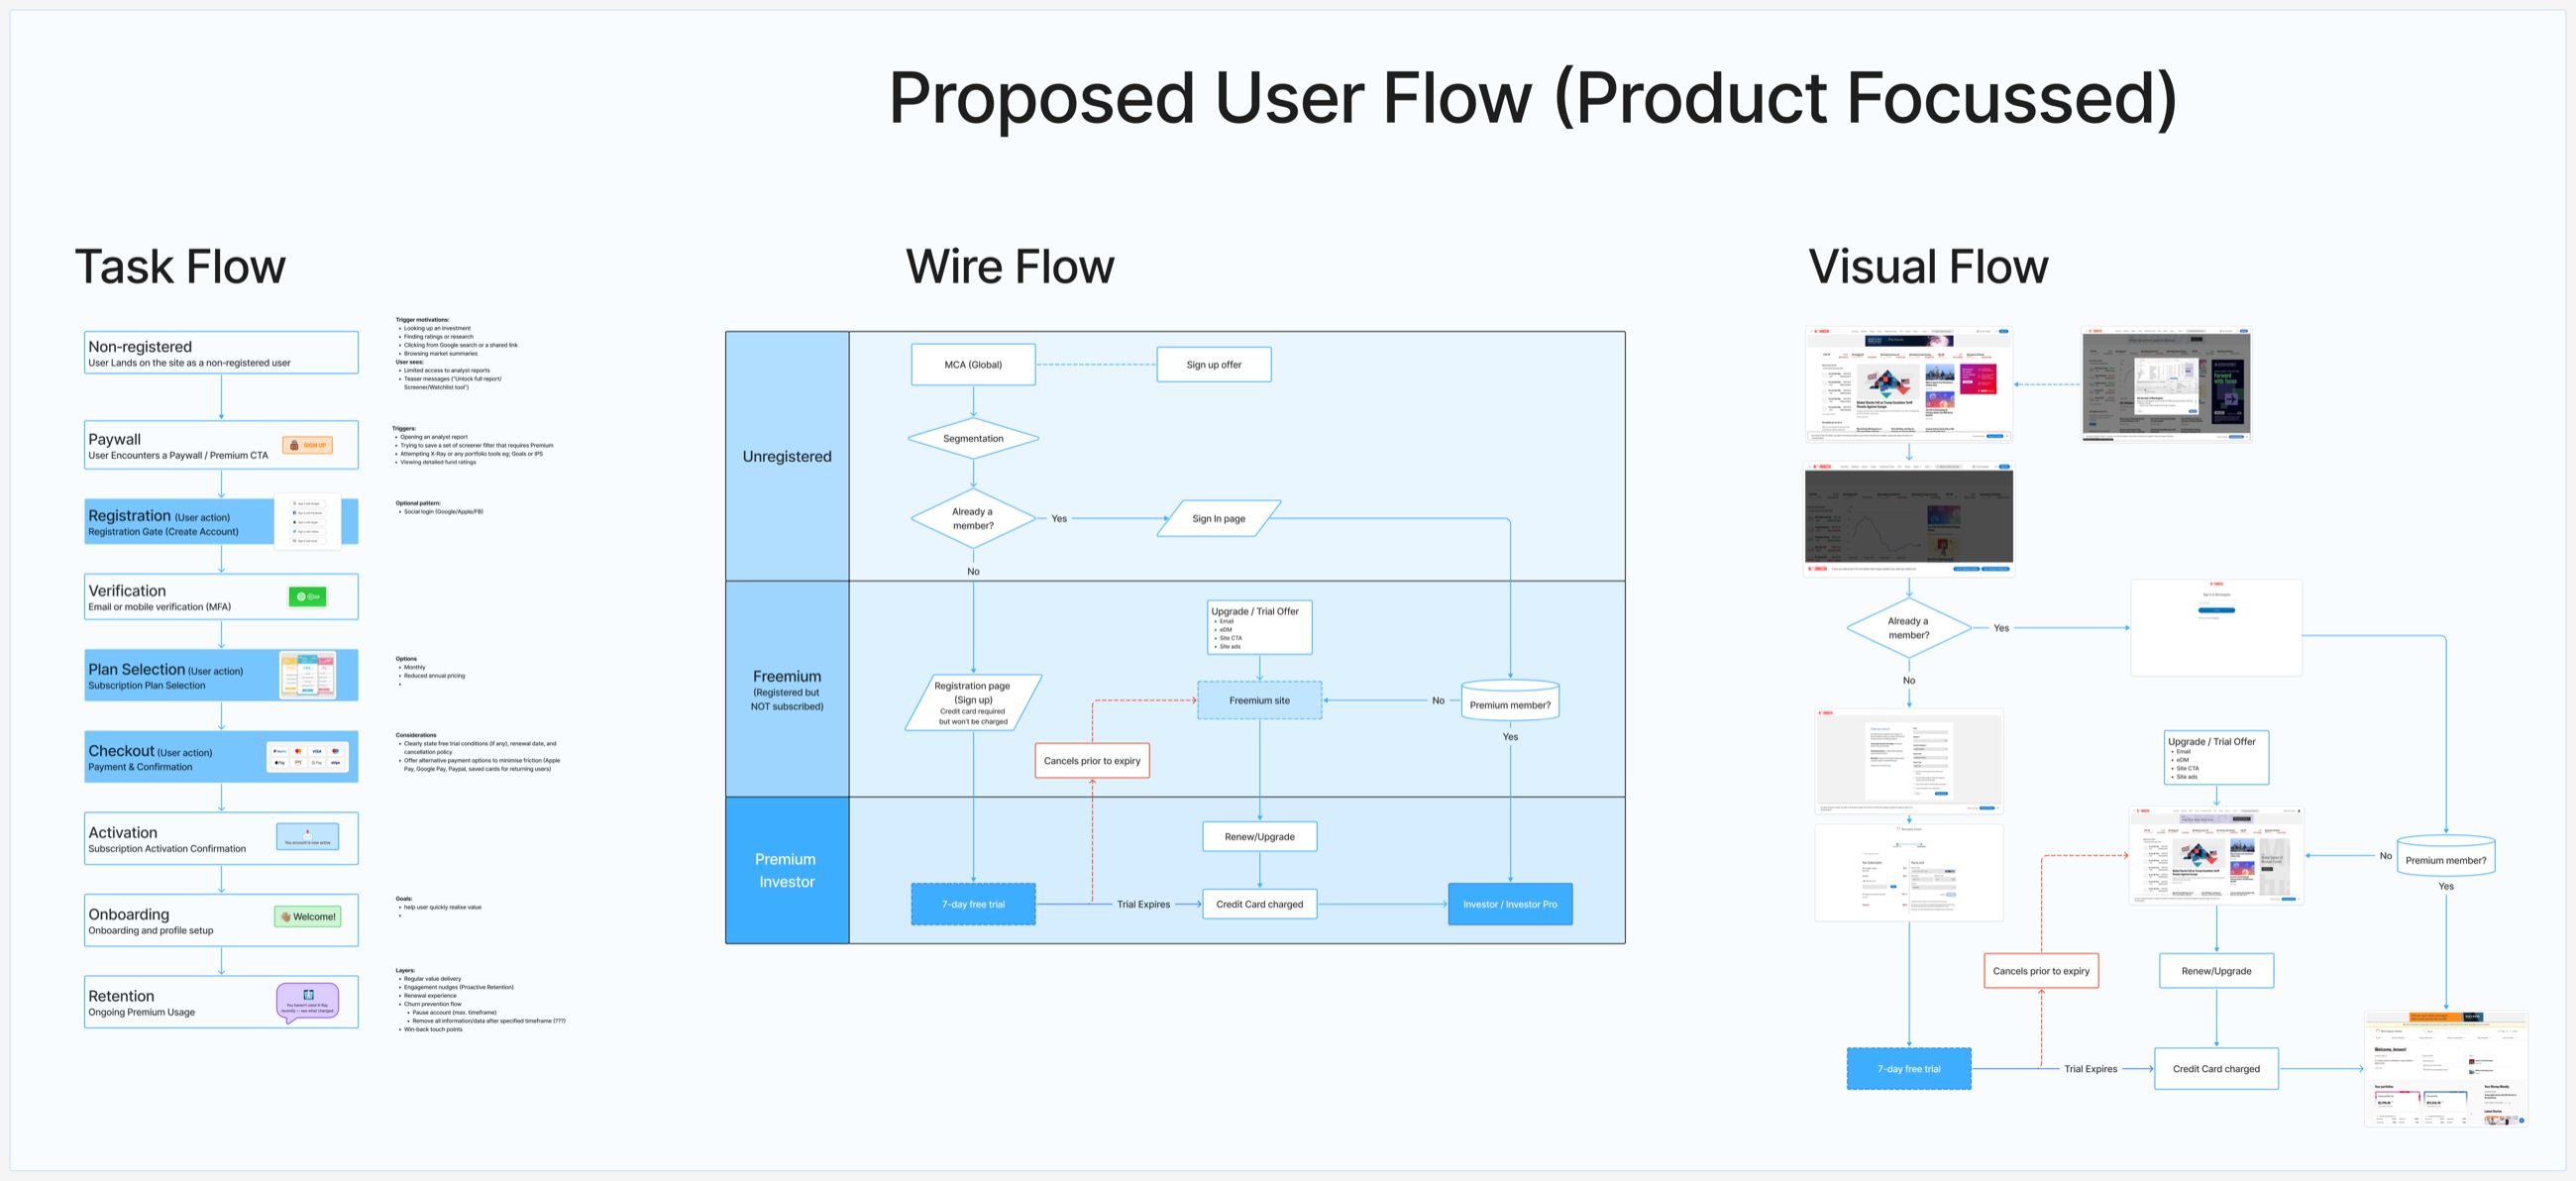
With the current flow mapped and the research in, I designed the proposed flow at three levels of detail. The task flow follows the person through nine stages and does not stop at payment: activation, onboarding and retention are part of the same journey. The wire flow turns those stages into a system with three membership levels. The visual flow lays it over real screens, to check that every step has a page to live on.
The nine stages in detail
- 01ArriveLands without an account, looking up an investment, or following a search result or shared link. Sees limited access and teasers.
- 02PaywallMeets the paywall at a moment of intent: opening an analyst report, saving a screener filter, trying X-Ray, viewing detailed fund ratings.
- 03RegistrationCreates an account. Social login as an optional pattern.
- 04VerificationVerifies by email or mobile.
- 05Plan selectionChooses monthly, or annual at a reduced price.
- 06CheckoutTrial conditions, renewal date and cancellation policy stated clearly. Alternative payment options to reduce friction.
- 07ActivationGets confirmation that the account is active.
- 08OnboardingSets up a profile, with one goal: reach value quickly.
- 09RetentionRegular value, engagement nudges, renewal, churn prevention, pause and win-back.
What changes
| Aspect | Today | Proposed |
|---|---|---|
| Membership levels | Four: unregistered, free site, trial, premium | Three: unregistered, freemium, premium |
| Registered free member | Does not exist | Freemium: registered but not subscribed |
| Free trial | 4 weeks, as its own level | 7 days, inside the premium level |
| Card details | Asked for when upgrading | Asked for at sign-up, not charged during the trial |
| When the trial ends | Needs a decision to upgrade | Continues to paid unless cancelled |
| If they don't continue | Back to the free site | Stays a freemium member |
Registration now creates a lasting freemium account, the middle state the Australian flow was missing. Asking for a card at sign-up raises the stakes for the user, so the checkout is explicit about trial conditions, the renewal date and how to cancel, and cancelling keeps the person as a freemium member instead of losing them.
Four journeys to prototype
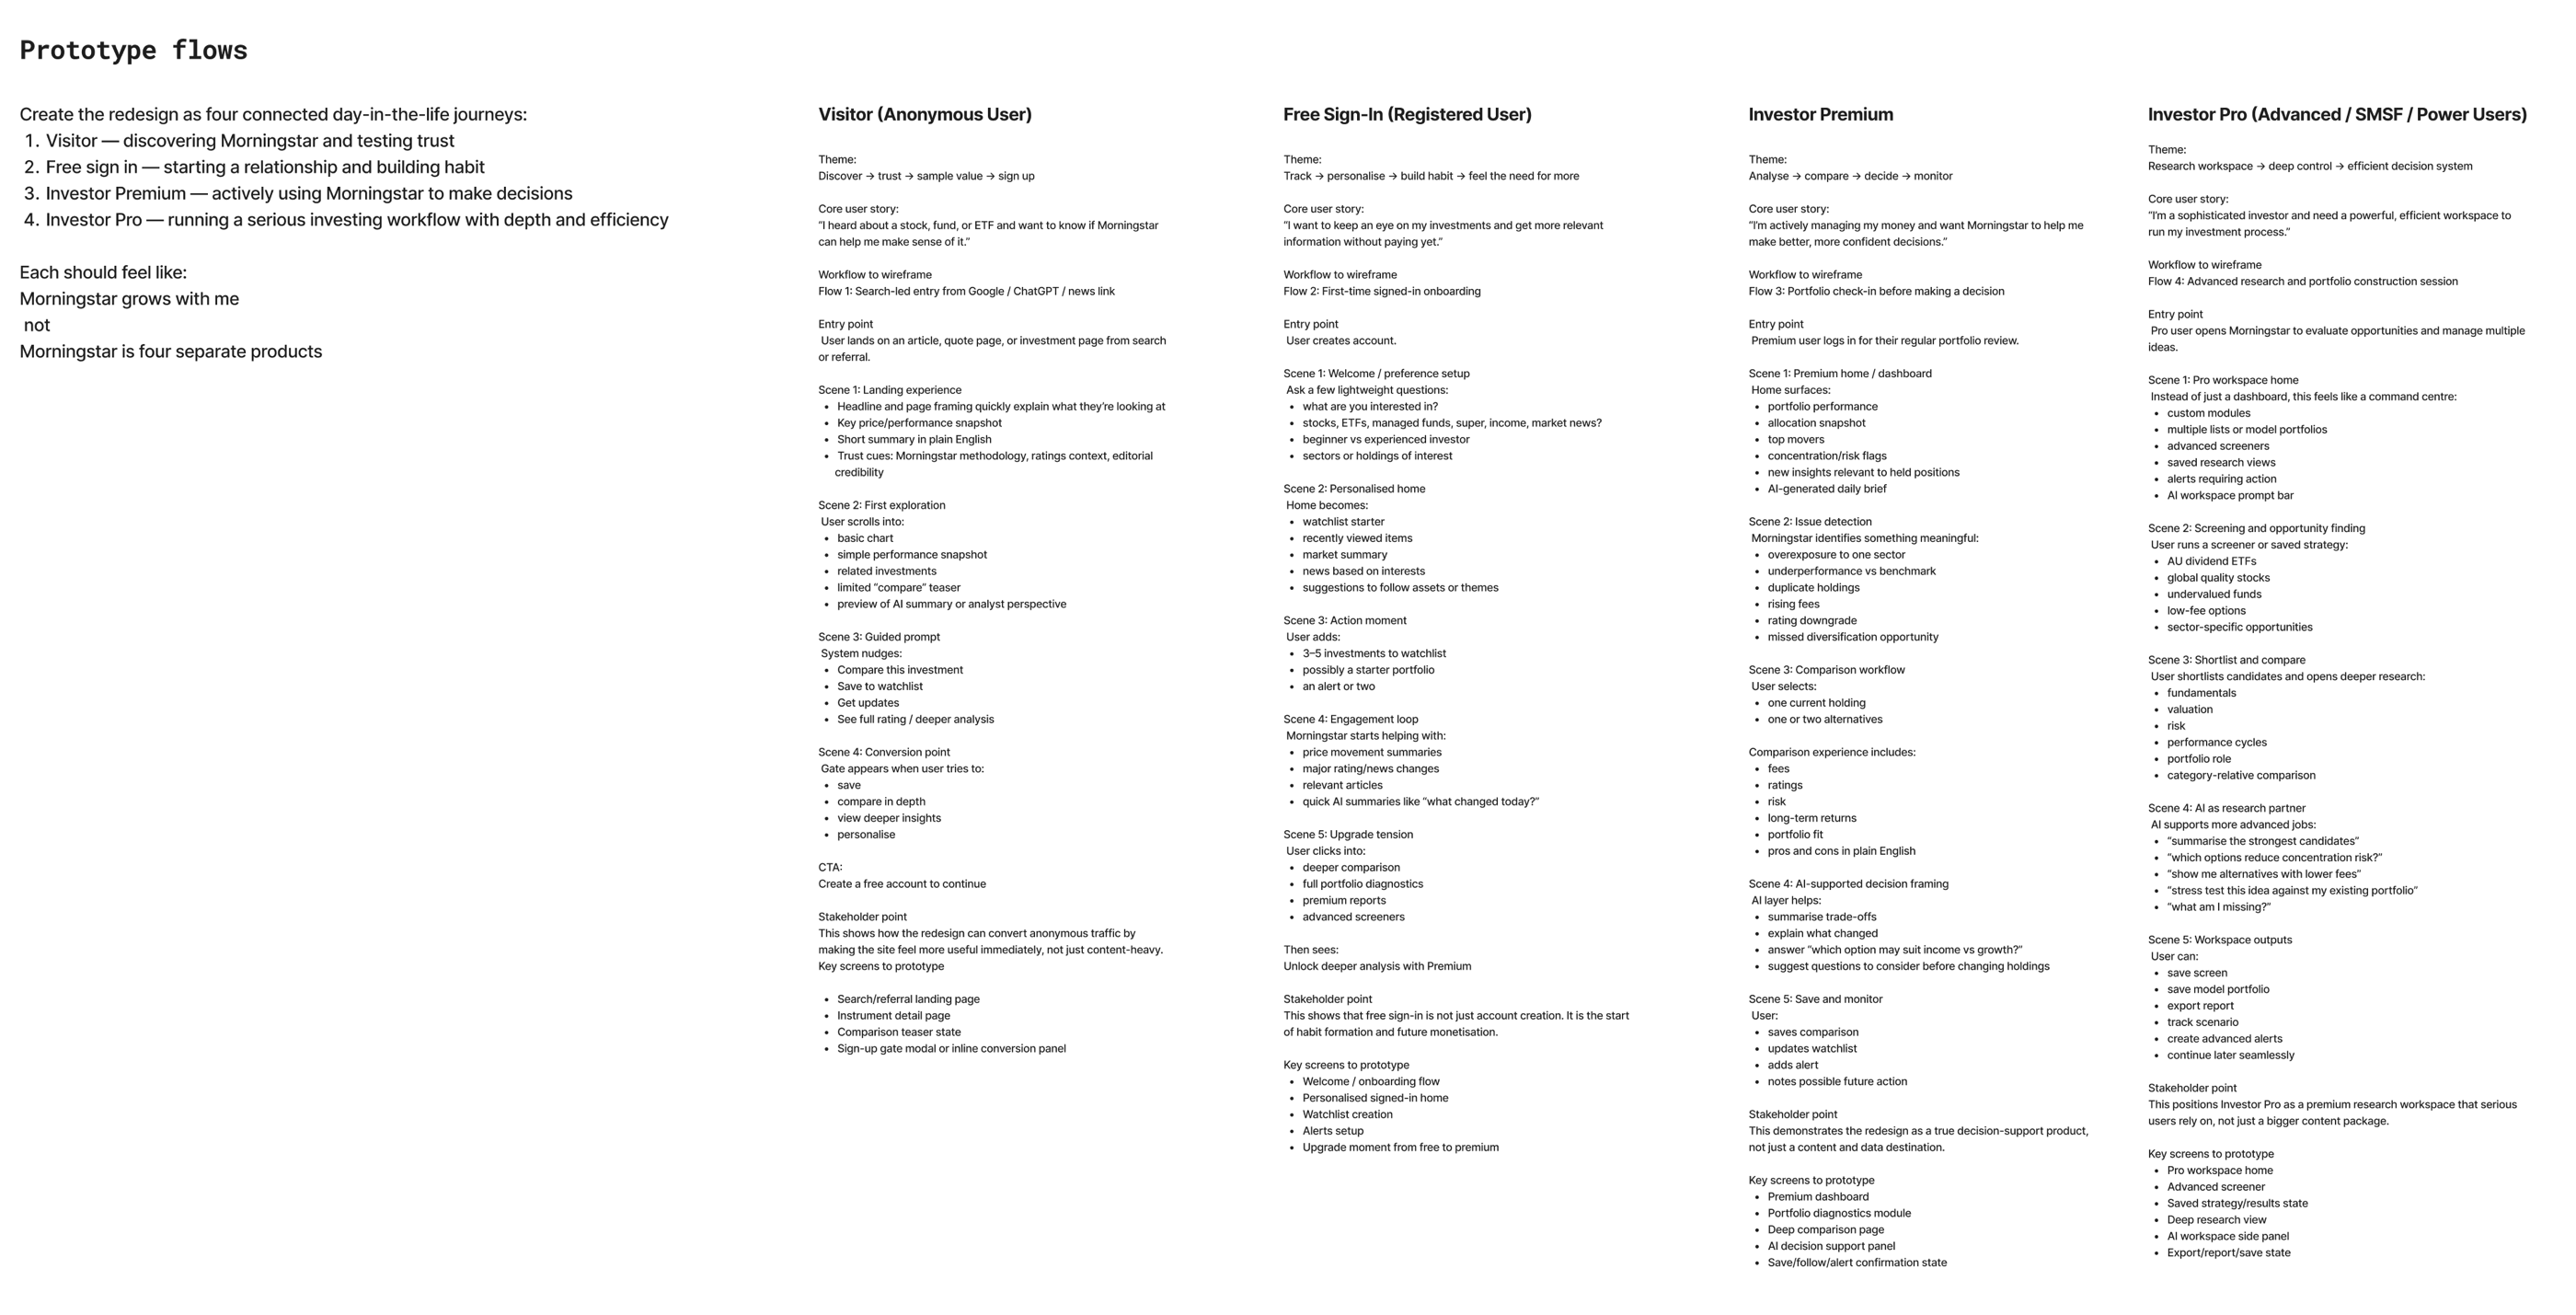
Before designing screens, I wrote the redesign as four connected day-in-the-life journeys, one per level. Each has a theme, a core user story, five scenes, the point it has to prove to stakeholders, and the key screens to prototype. Together they set one rule for every screen that followed.
The rule
Morningstar grows with me, not Morningstar is four separate products.
Visitor
Anonymous
"I heard about a stock, fund or ETF and want to know if Morningstar can help me make sense of it."
Discover → trust → sample value → sign up
- Search or referral landing page
- Instrument detail page
- Comparison teaser
- Sign-up gate
Free
Registered
"I want to keep an eye on my investments and get more relevant information without paying yet."
Track → personalise → build habit → feel the need for more
- Welcome and onboarding
- Personalised signed-in home
- Watchlist creation
- Alerts set-up
- Upgrade moment
Premium
Investor
"I'm actively managing my money and want Morningstar to help me make better, more confident decisions."
Analyse → compare → decide → monitor
- Premium dashboard
- Portfolio diagnostics
- Deep comparison page
- AI decision support panel
- Save, follow and alert confirmation
Pro
Advanced, SMSF, power users
"I'm a sophisticated investor and need a powerful, efficient workspace to run my investment process."
Research workspace → deep control → efficient decision system
- Pro workspace home
- Advanced screener
- Saved strategy and results
- Deep research view
- AI workspace side panel
- Export, report and save
Each journey ends where the next begins. The visitor hits a gate and creates a free account. The free member feels the need for more and meets the upgrade moment. The Premium member's comparison leads into the deeper workspace of Pro. The screens in the next section are these journeys, drawn.
The interface
I designed Investor Pro as a grid: every tool, at every membership level, in every state. I defined the component library first, then designed the screens from it at three sizes: the account and visitor pages, the editorial pages, the four tools at each level, and the navigation that holds them together. The article page went through to development first.
100+
screens, at large, medium and small sizes
5
levels: visitor, Free, Premium, Pro and Enterprise
370+
components in the library
One tool, five levels
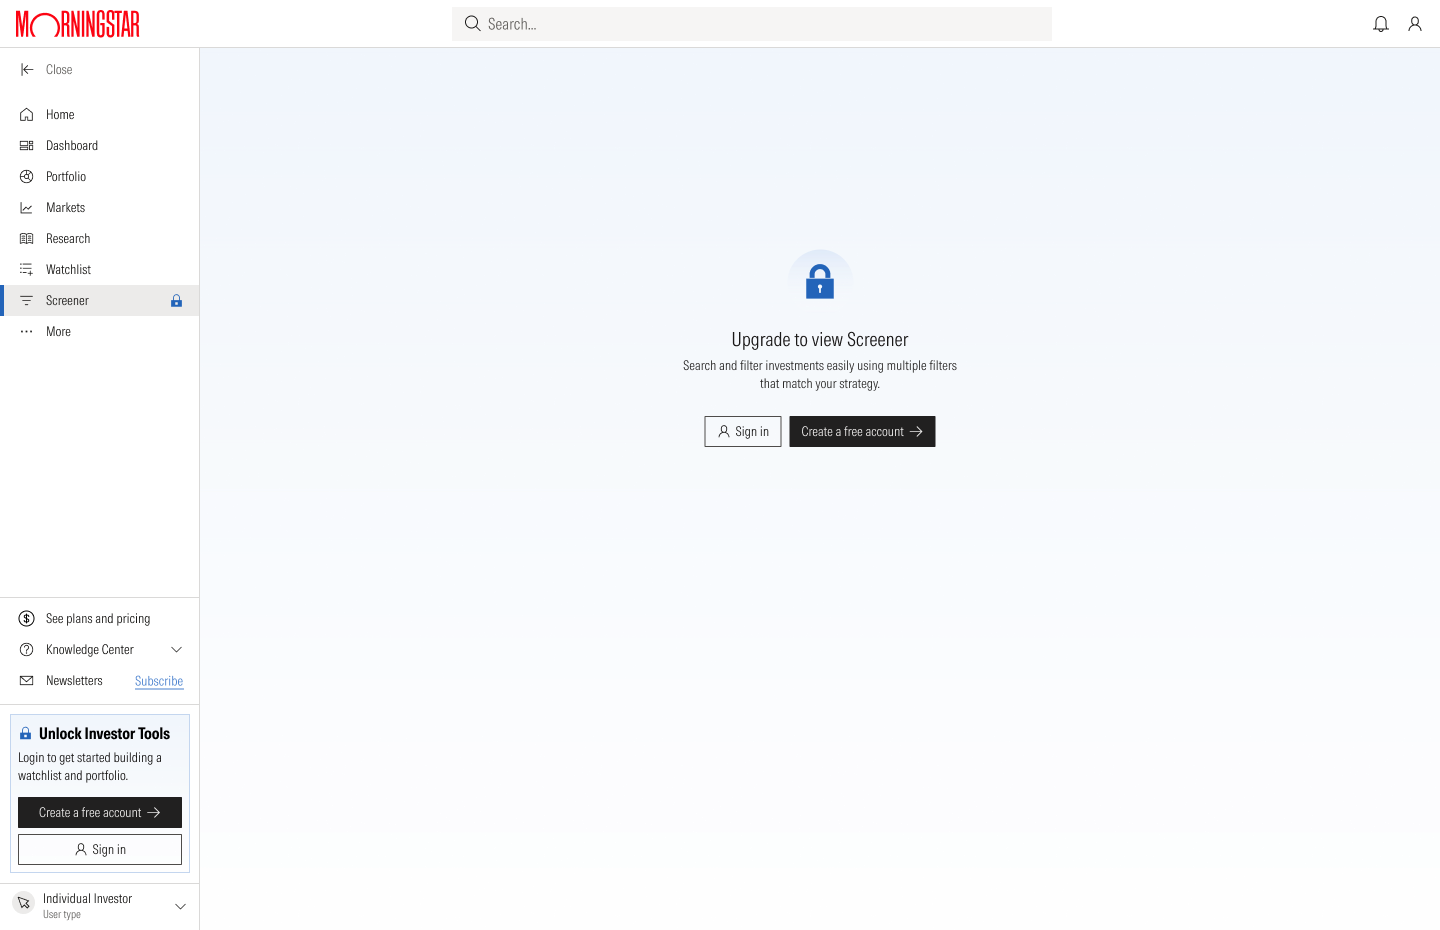
Read each row from left to right. A visitor meets a locked page with a way in. A free member gets a working tool with some features held back. The paid levels open it up, and Enterprise adds governance: shared lists with a draft and published status. The layout never moves. Only the depth changes.
Visitor
Free
Premium
Pro
Enterprise
Screener


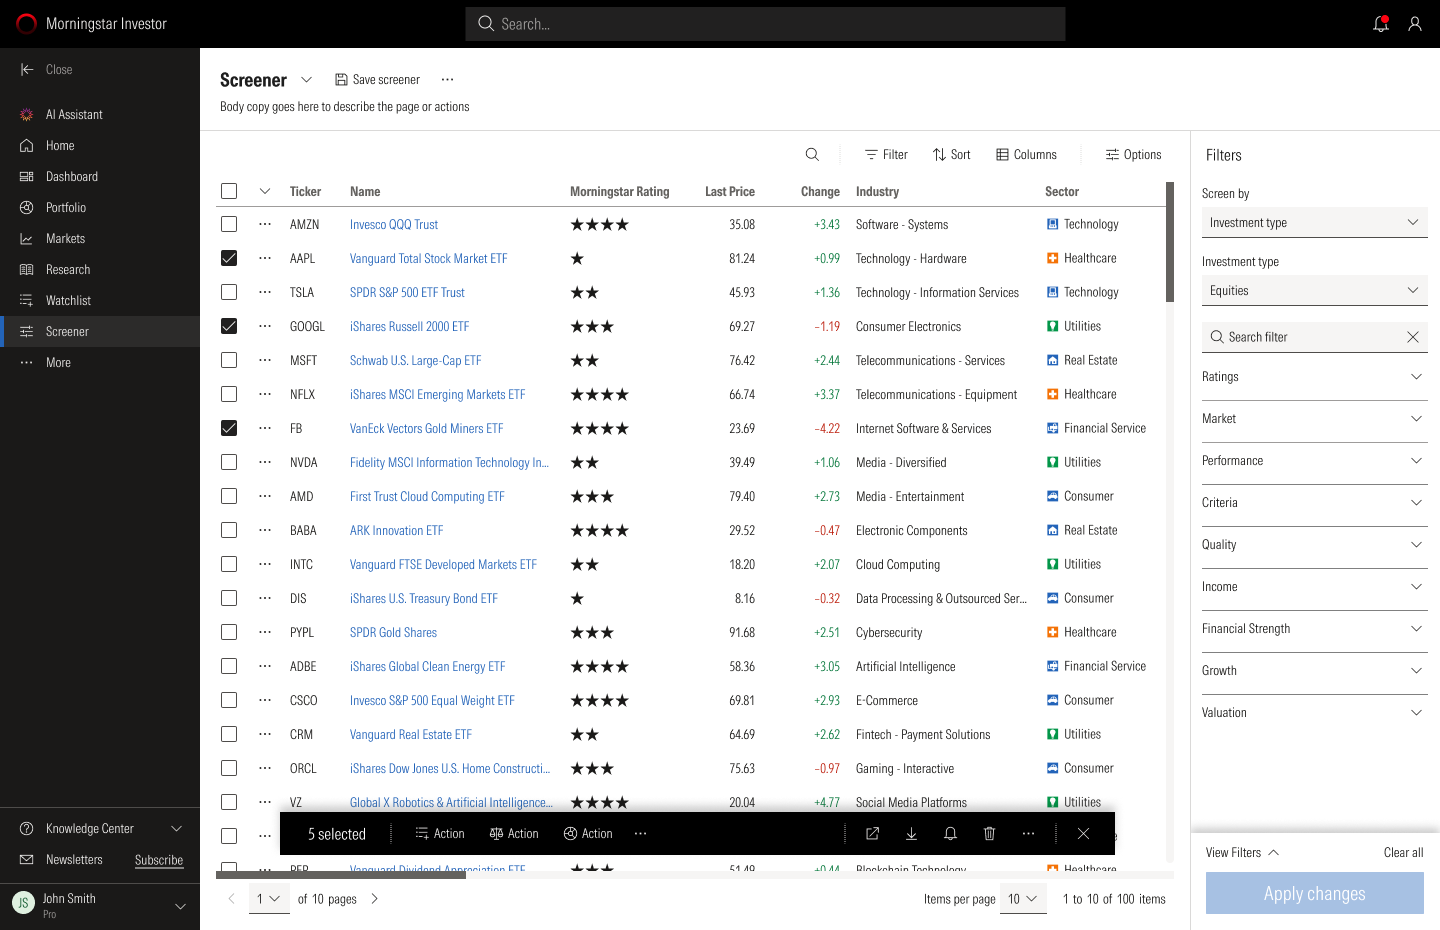

Watchlist
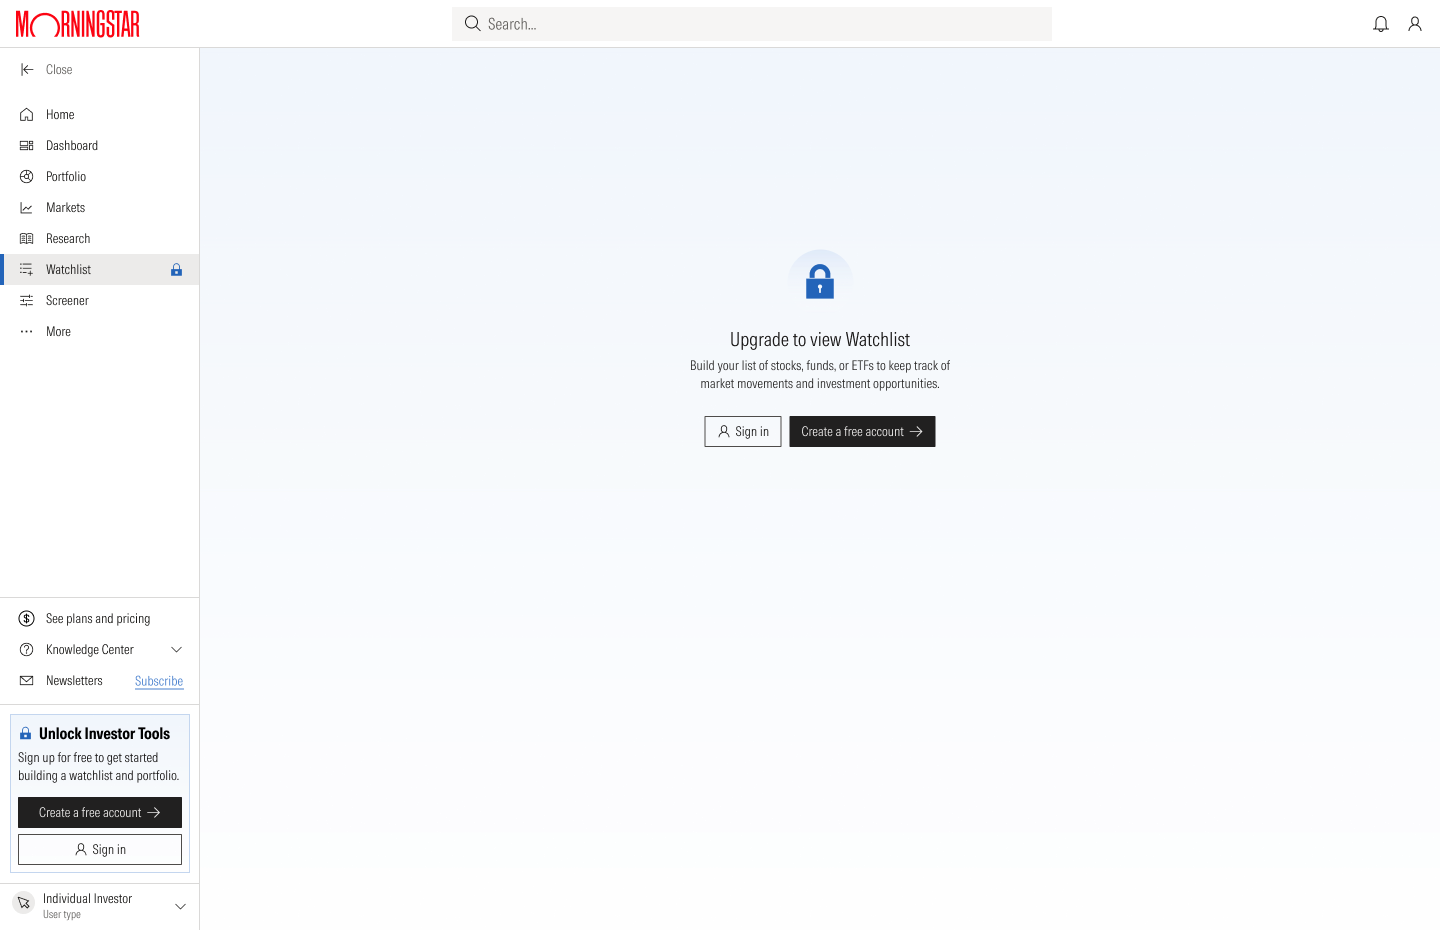
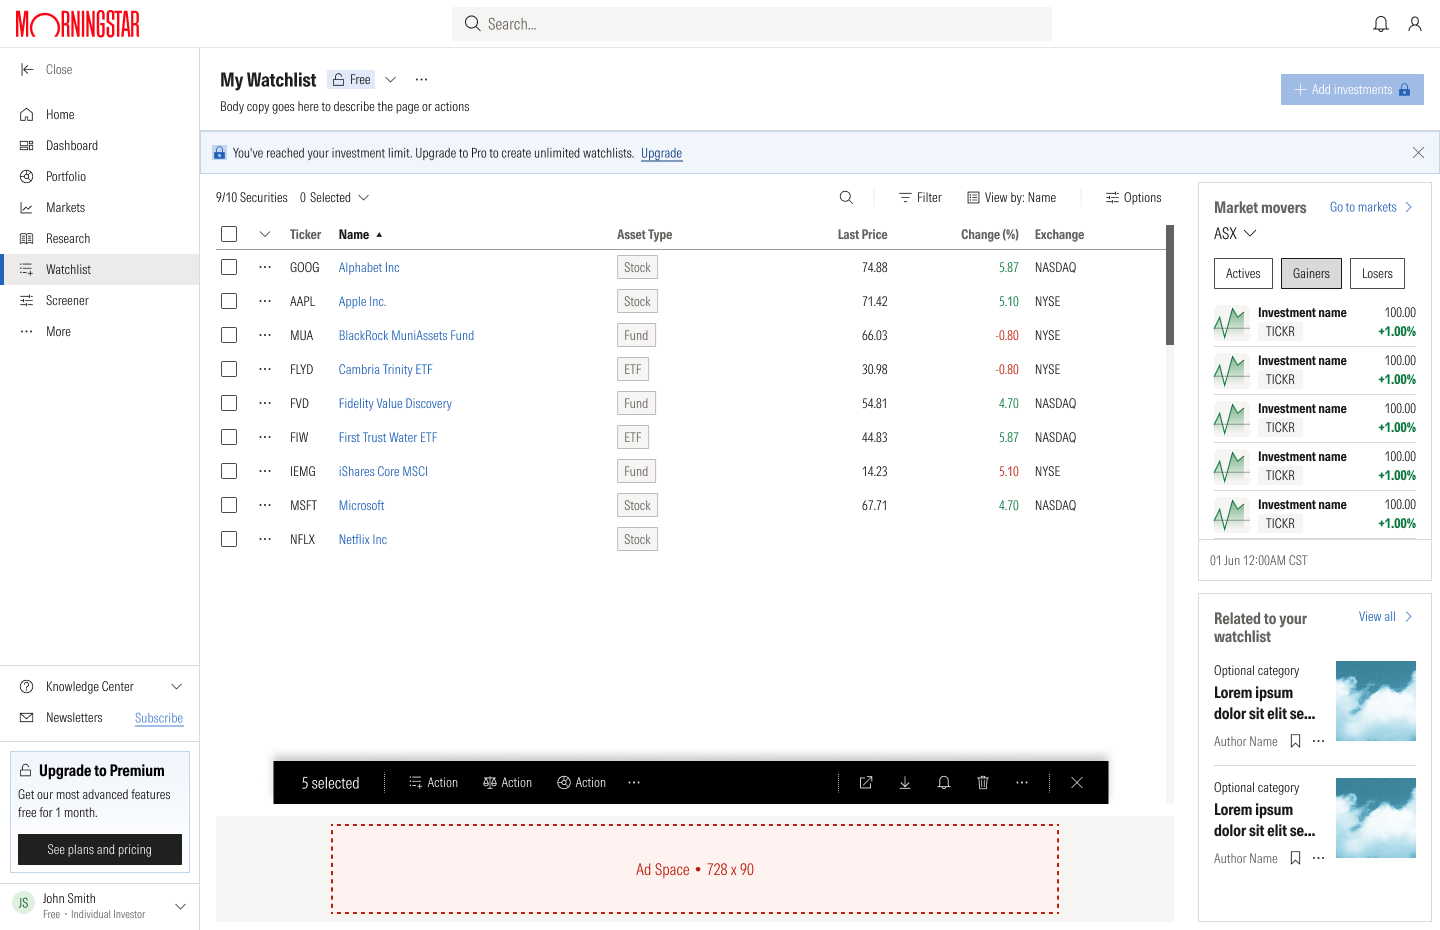

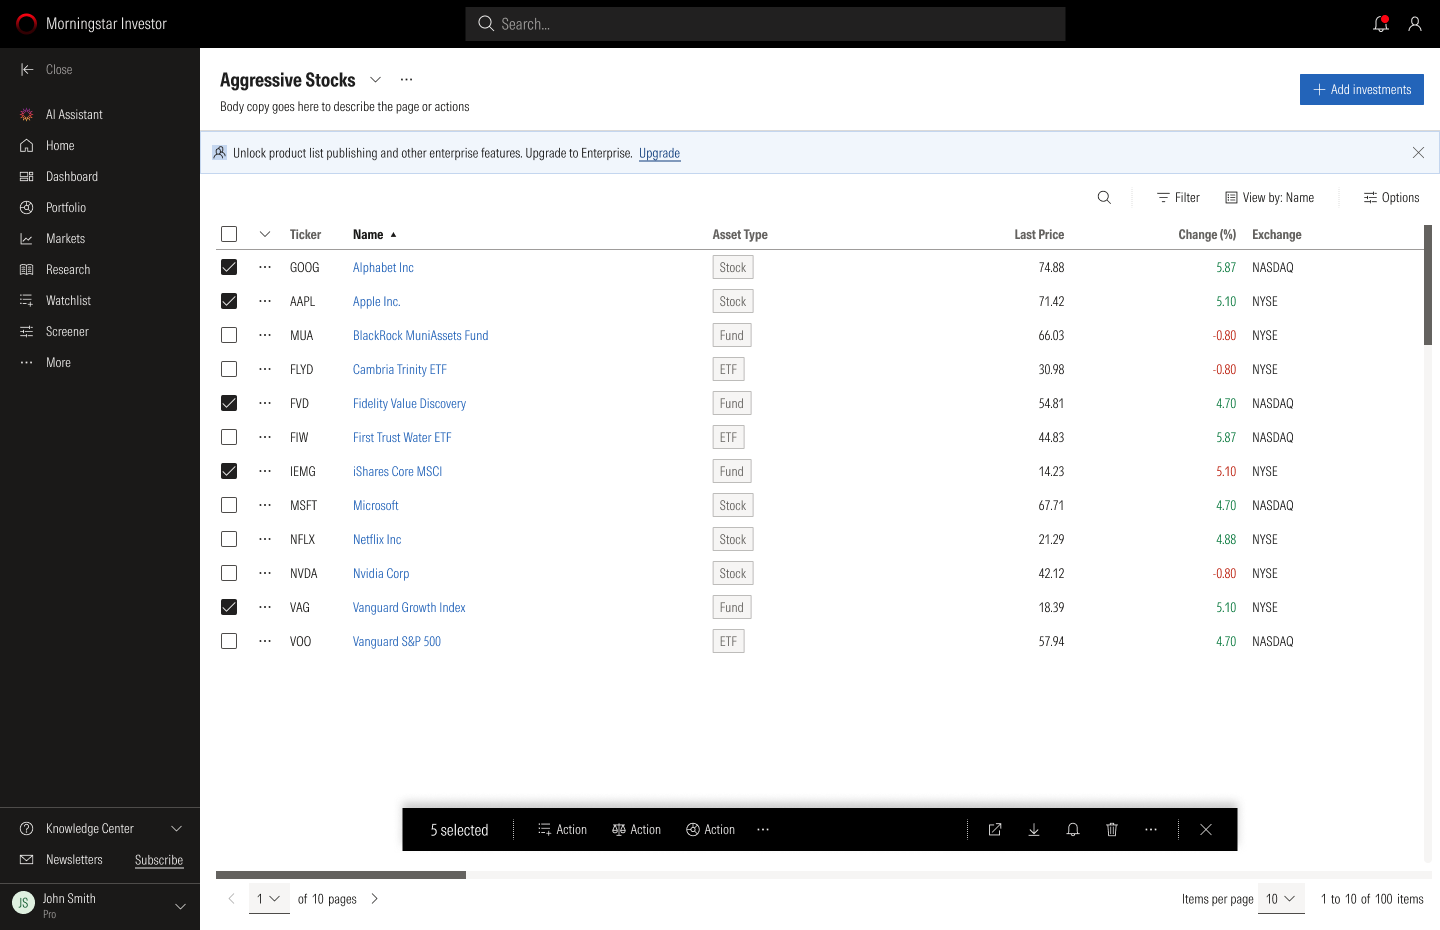
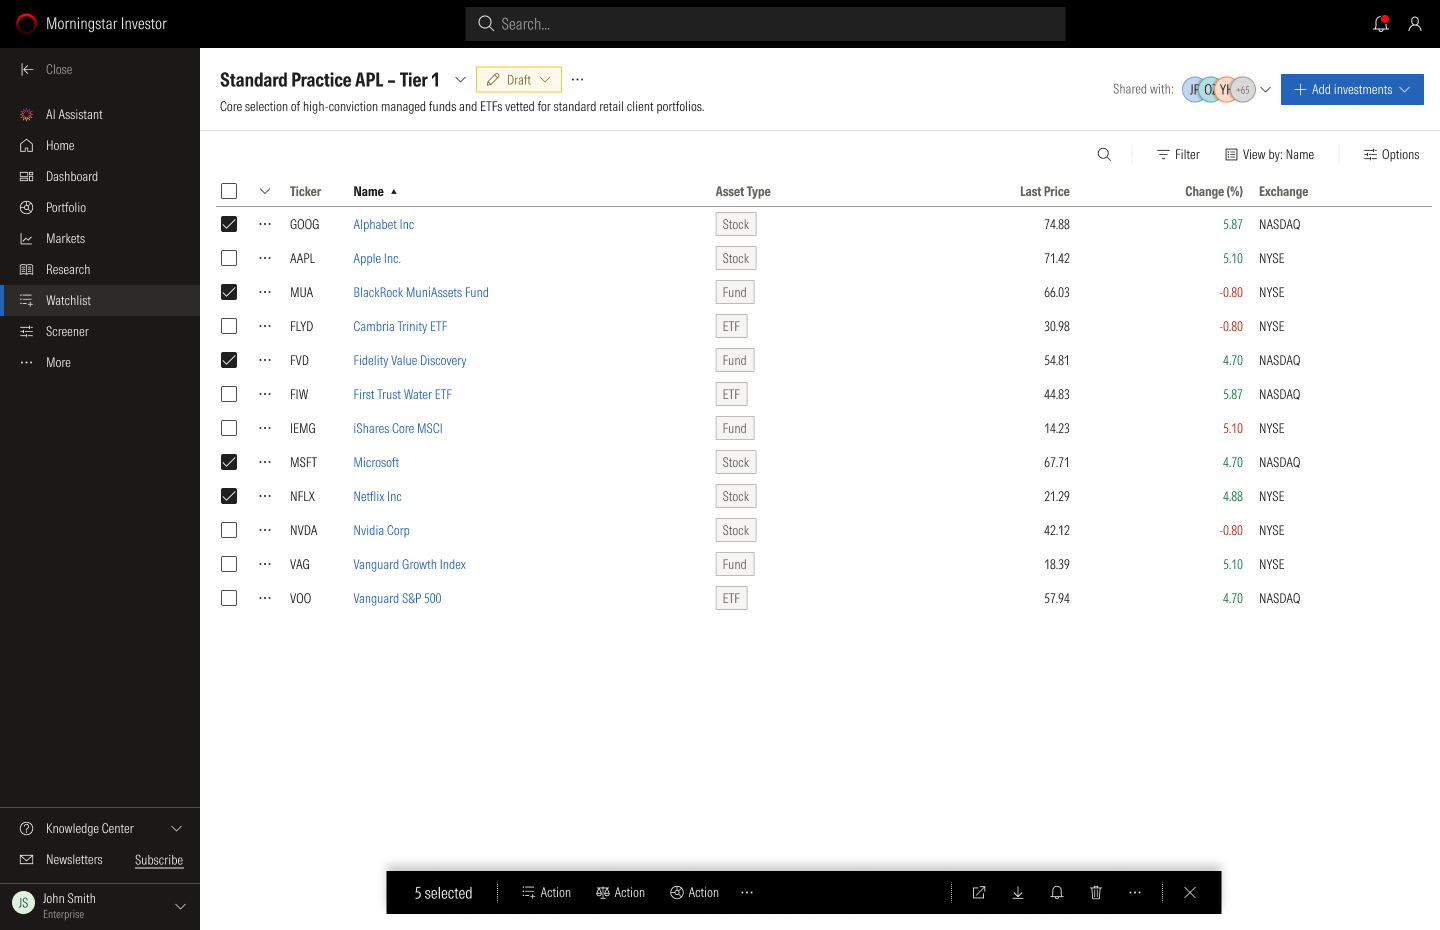
Same tool, different job
The words change with the audience. An investor is looking for opportunities, an adviser is supporting advice, and a practice is governing a product list.
| Level | Screener | Watchlist |
|---|---|---|
| Investor | Discover investment opportunities that match your goals | Build your list of investments to keep track of market movements |
| Pro | Search and filter investments efficiently to support your advice process | Construct your defensible product list |
| Enterprise | Build and maintain approved product lists | Track investments from research through governance, and publish approved product lists |
Testing the Screener
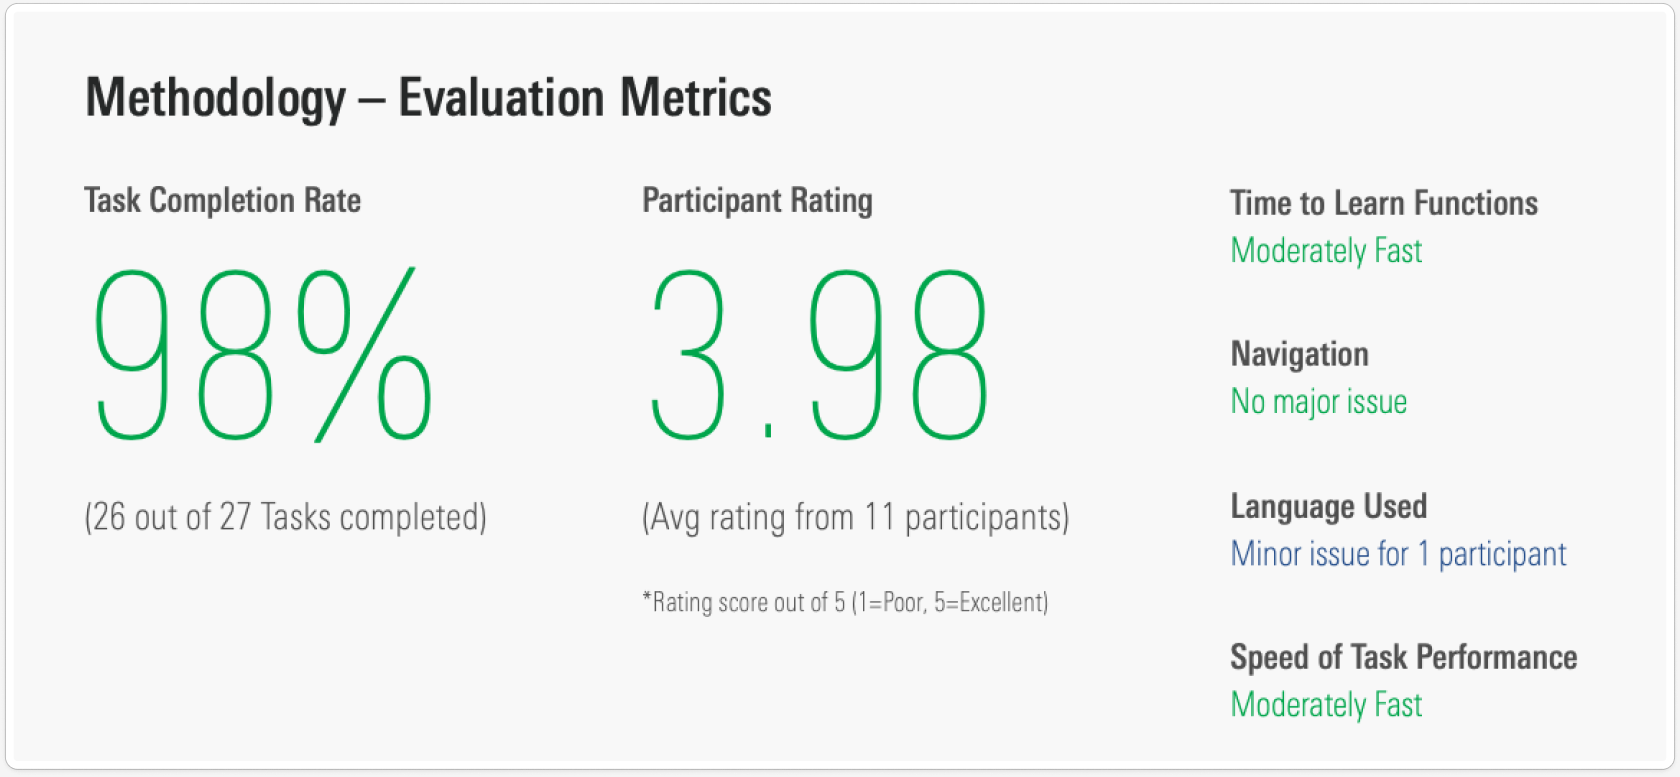
I ran usability sessions on the new Screener with 12 people, six advisers and six investors, with the product manager, the lead developer and a customer success manager sitting in. Each person worked through four tasks: move between investment types, find a filter, search for a security, and move between tab groups. We also asked them to compare it with the screener they use today.
98%
of tasks completed
3.98
out of 5 satisfaction, average of the participants who rated it
88
SUS score, against 69 for ARC and 59 for Investor
The six advisers, all ARC users, were clear about what ARC lacked overall, not only in the screener.
- ExportAdvisers download a CSV from ARC and work in Excel. They want to export data and add their own ratios.
- ColumnsMore detail in the columns, so more can be read on one screen, and a summary page for quick reference.
- RatingsThe difference between the Morningstar Rating and the Medalist Rating is not clear.
- CategoriesThe Morningstar Category list is very granular. One adviser called it intimidating.
- AvailabilityPlatform and wrap availability is valued in a fund screener, and should stay.
- SearchThe current ARC screener is not easy to use, so some advisers avoid it. It does not search widely enough or show enough ratios.
- NavigationThe current site is hard to find your way around and hard to compare funds in. Advisers wanted the tools they use most, like the screener, reachable from the front page.
- ScopeAdvisers want to manage international holdings alongside Australian equities.
- AIOne adviser wanted to ask questions of Morningstar's data in plain language, rather than build queries by hand.
- ReportingAdvisers asked for fuller portfolio reporting and better tools to analyse the data.
- Look and feelThe new Screener was rated four out of five, with a note that it could be more attractive to use.
- Client-facing visualsAdvisers use visual illustrations to explain investments to clients, and want tools that support that.
The six investors ranged from beginners to people who do their own analysis in Excel. Like the advisers, most of what they raised was about the current site, not only the screener.
- Plain wordsOne newer investor did not know terms such as "investment screener" and asked for simpler labels, with a short explanation where a term could not be avoided. She said the site felt like an information dump.
- Notes and savingMore than one investor wanted to add their own notes to an investment, a watchlist or a portfolio. One could not save funds to come back to.
- SpeedTwo investors said the site is slow.
- NavigationPeople wanted more rows on a page, a way to set how many show, and links that open in a new tab. One lost his place when he sorted a list and sorted it again.
- CompareOne investor wanted to pick several stocks and compare them side by side before deciding.
- FilteringOne investor showed how he filters for stocks with a dividend yield above 8. He wanted a filter that is strong and easy to use.
- NewsOne investor said that after screening he watches a stock for a while and follows its news. Another wanted news alerts on the companies he holds in one place, instead of visiting several sites.
- DataExperienced investors wanted fields the tool did not have, such as beta, data over long periods and ESG factors, and a way to pull it into Excel. One wanted to see the assumptions behind the analysis, such as the discount rate and growth rates.
- Portfolio toolsTools for building and analysing a portfolio, such as correlation between markets, were available to advisers but not to investors. One investor wanted to set up a hypothetical portfolio and get alerts on it.
- SearchThe main search on the site moved when clicked, which annoyed one investor. Another said search did not work the way he needed.
- Look and feelOne investor called the design flat and monotonous. Another asked for darker text and for investment names in blue, as he was used to, so they read as links.
- MobileOne investor avoided the site on a phone for screening, but used it there to read up on a single stock.
What people told us, and what it changed:
Both groups
Everything on one screen
The thing people liked most was not jumping between pages. Filters stay on the left and results update in place.
Advisers
More data, and a way out
Advisers wanted more columns on one screen, export to a spreadsheet, and saved screens with alerts. Column choice, export and saved screens went into the Pro level.
Investors
Plain words
Beginners stumbled on terms like "investment screener" and "capital allocation". Labels were rewritten and short explanations added where a term could not be avoided.
Investors
Speed and control
People wanted more rows per page, links that open in a new tab, and to compare the securities they had selected. Compare from a selection became part of the design.
Four ways to hold something back
A tiered product depends on how it says no. I used four patterns, from the strongest to the lightest. Each one names what is behind the lock and offers the way to open it.
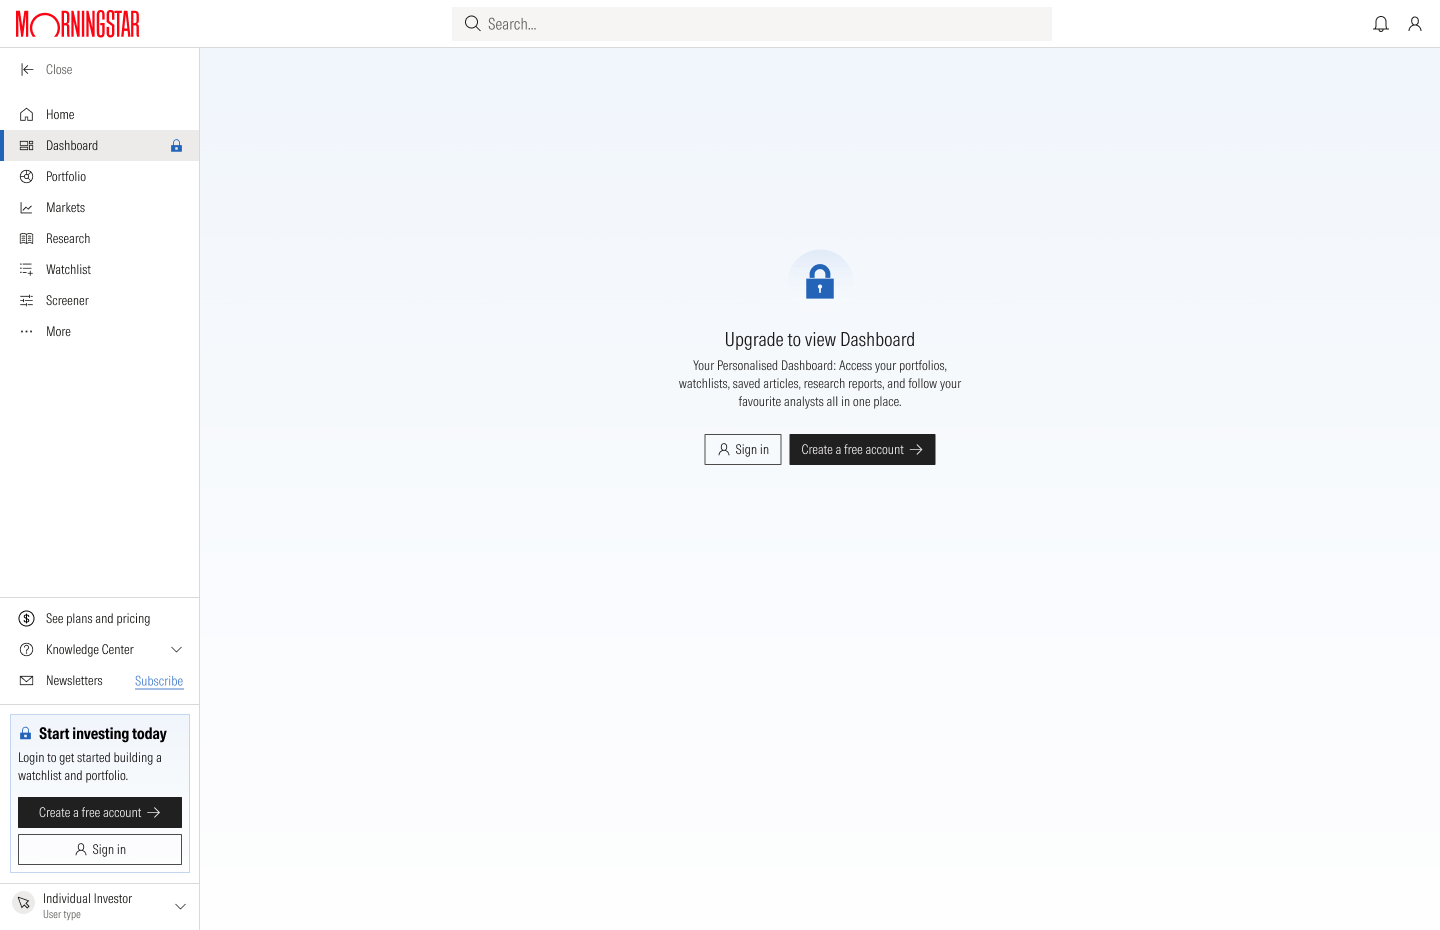
Locked pageThe whole page, with a way in
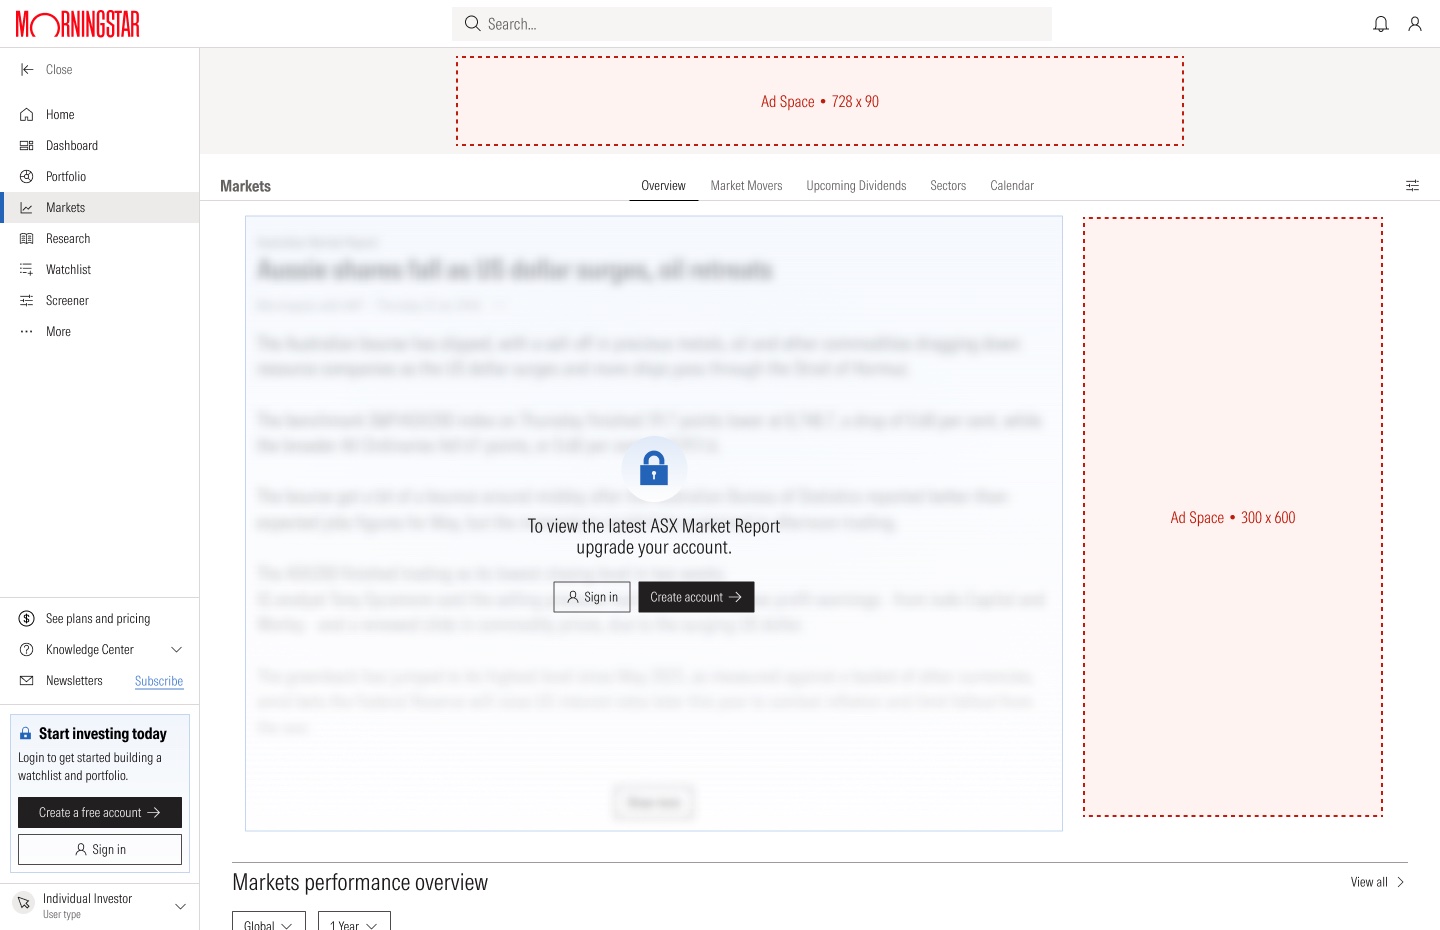
Blurred previewThe content is there, out of reach
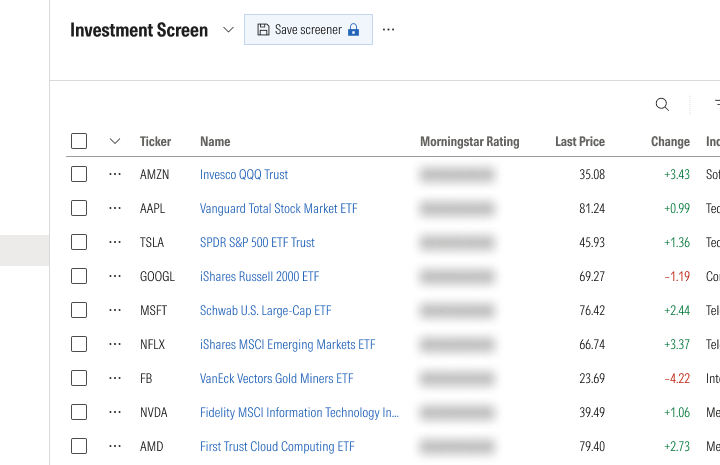
Locked featureThe tool works. Saving and ratings do not.
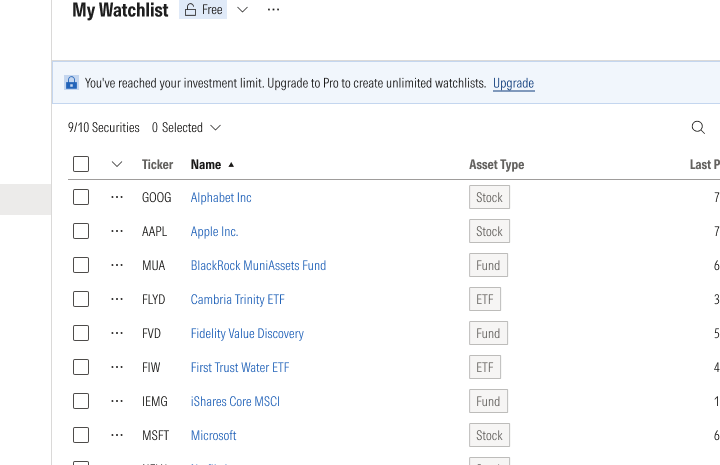
Visible limit9 of 10 used, and how to get more
Three states for every tool
Each tool is designed for the first visit, the return visit and the working view. The first visit explains the tool and offers one action. The return visit opens on saved work.
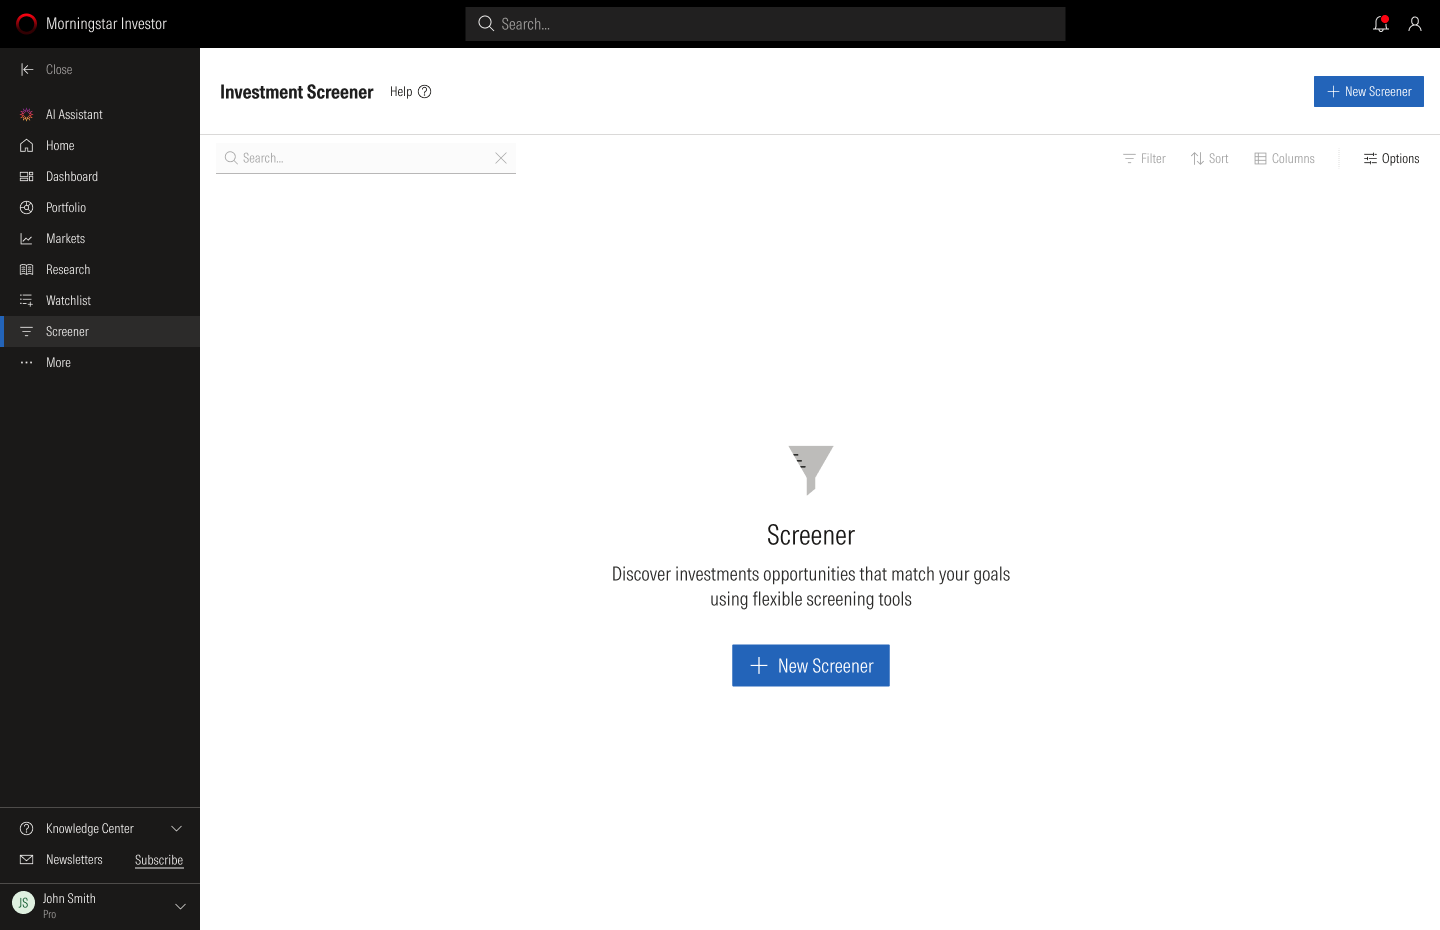
First visitWhat it is, and one action

Return visitSaved screens

Working viewResults, with filters closed
Joining and upgrading
Sign-up is one short form. The plans page changes with who is looking: a visitor sees Free, Premium and Pro, a free member sees their current plan marked, and a Premium member sees Premium, Pro and Enterprise.
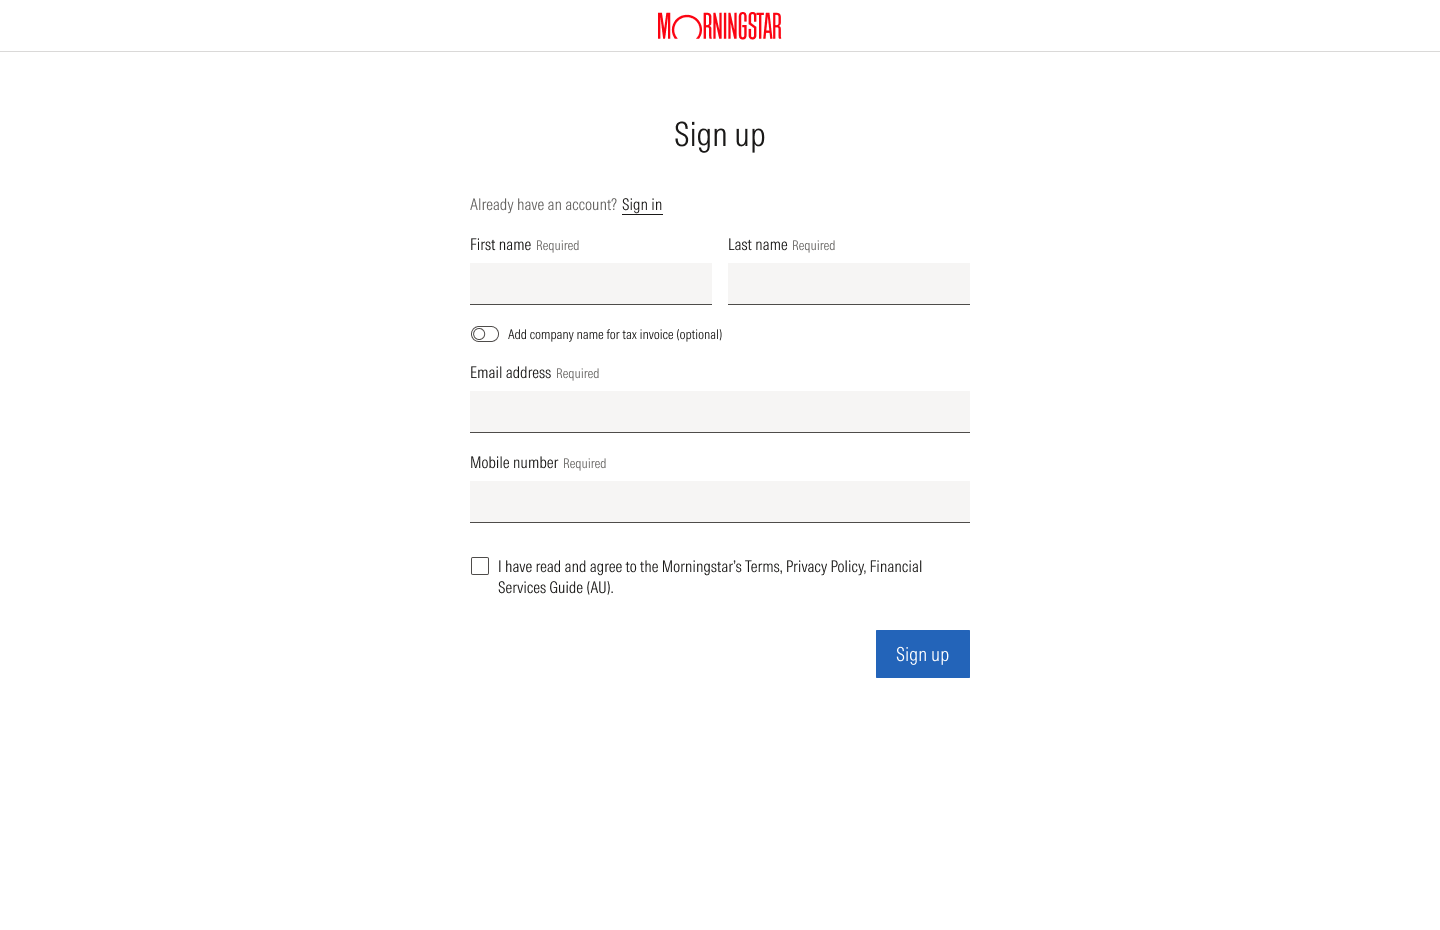
Sign upOne short form
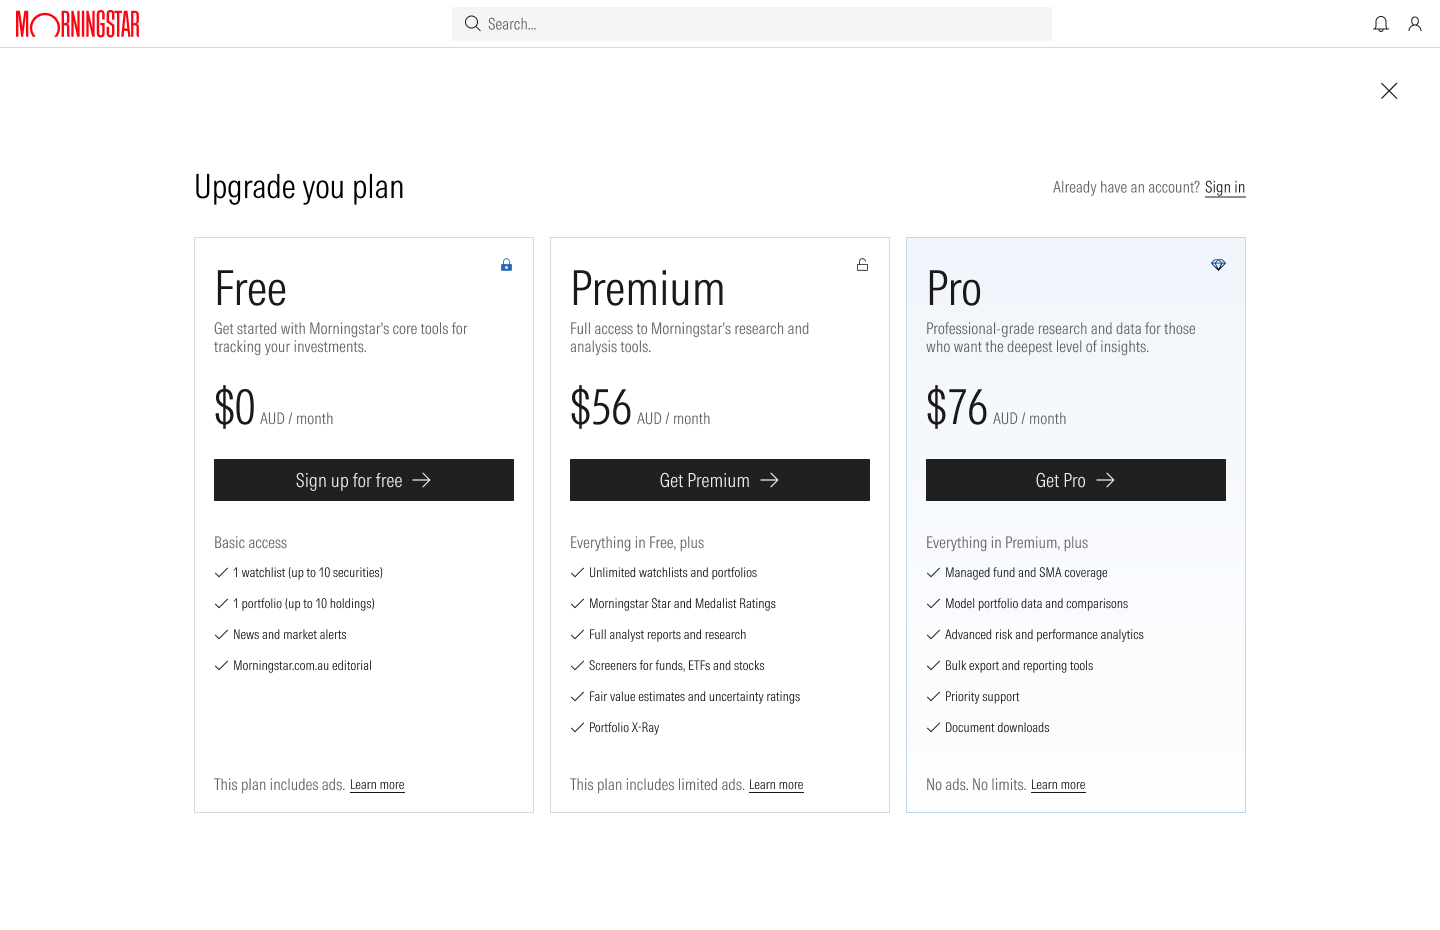
Plans for a visitorFree, Premium and Pro
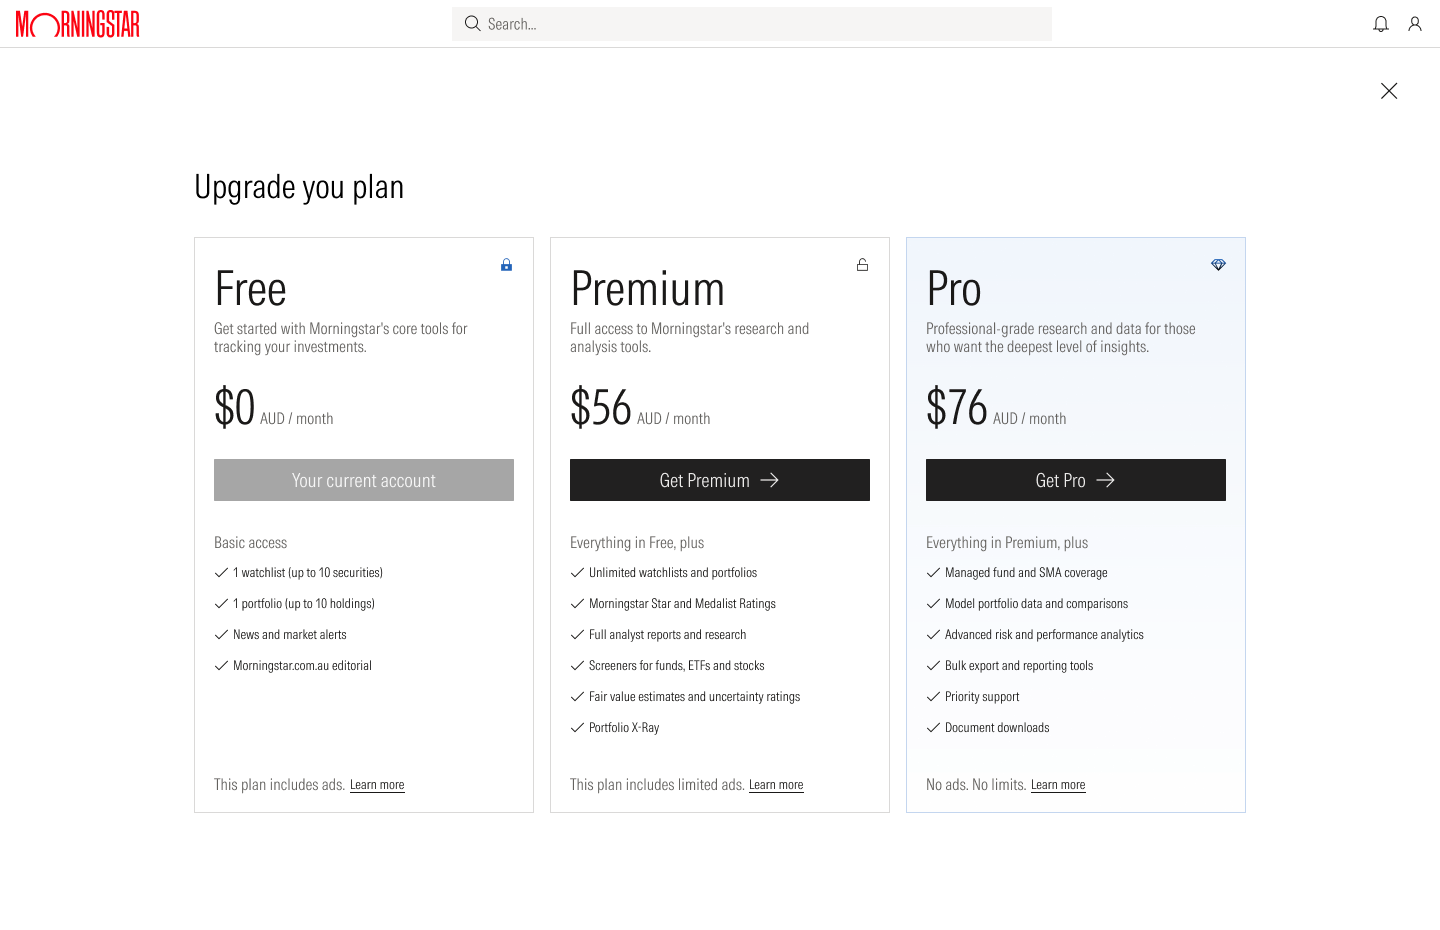
Plans for a free memberCurrent plan marked

Plans for a Premium memberPremium, Pro and Enterprise
Reading and research
Editorial pages keep one structure for visitors and members. Members get a darker header, the AI assistant in the navigation, and a prompt to upgrade in place of the prompt to join.
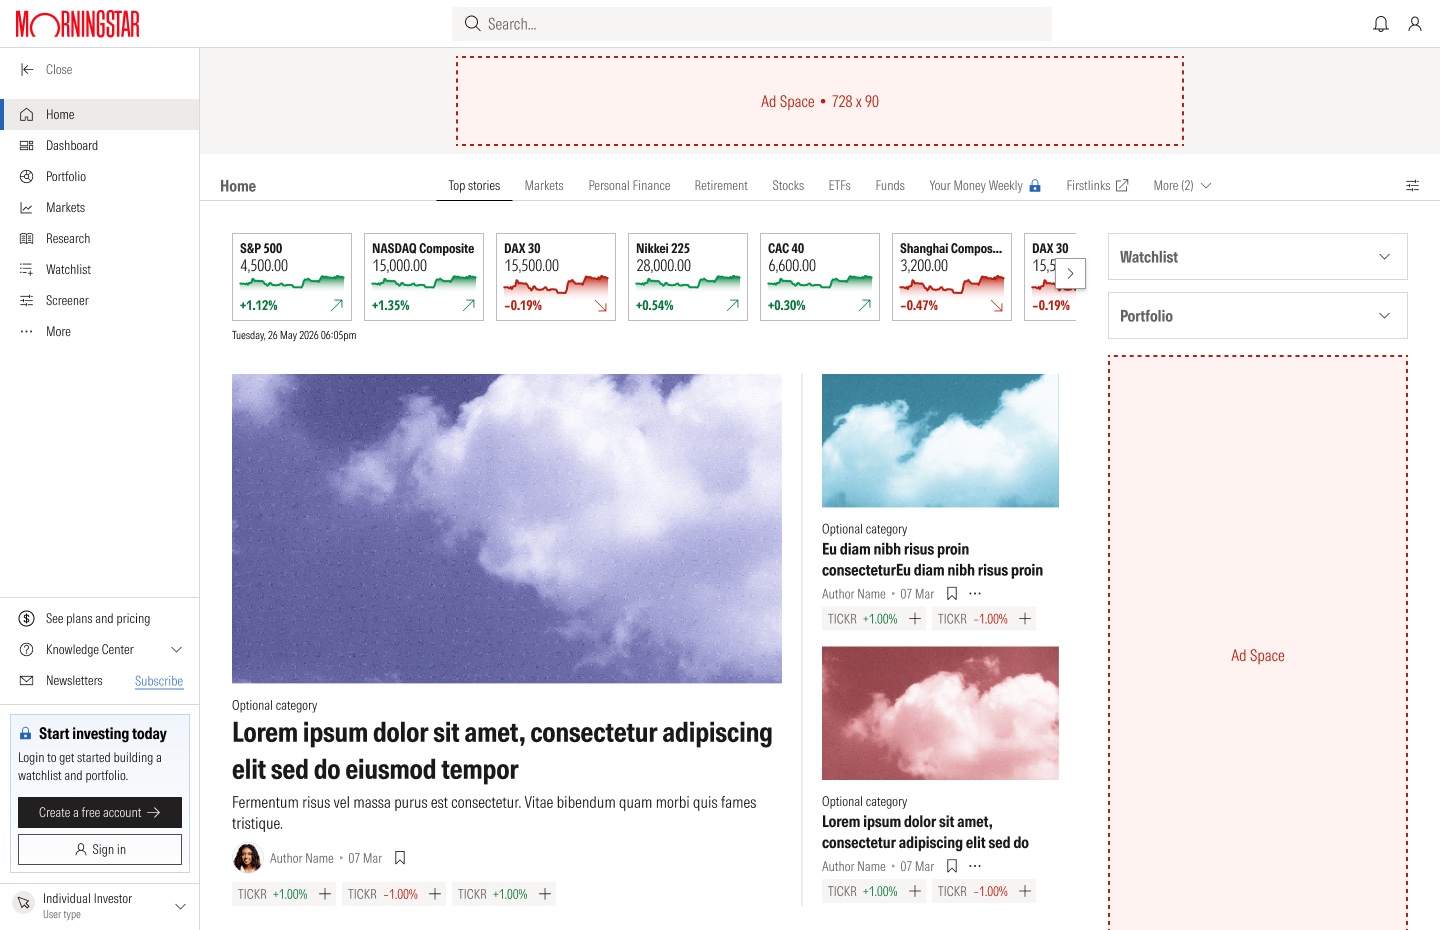
Home, visitorPrompt to join
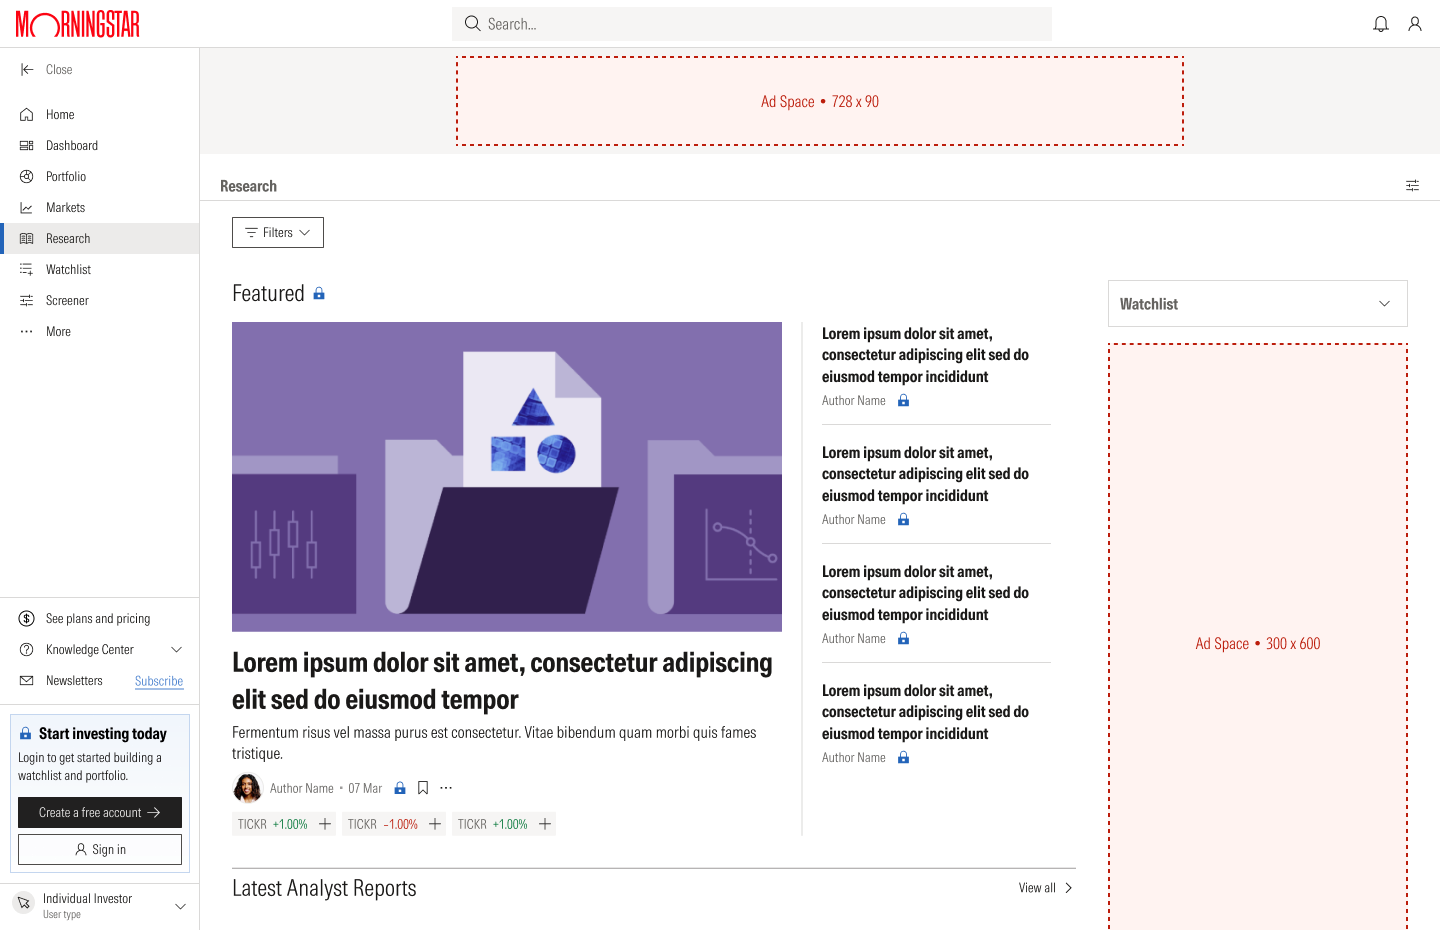
Research, visitorReports marked as locked
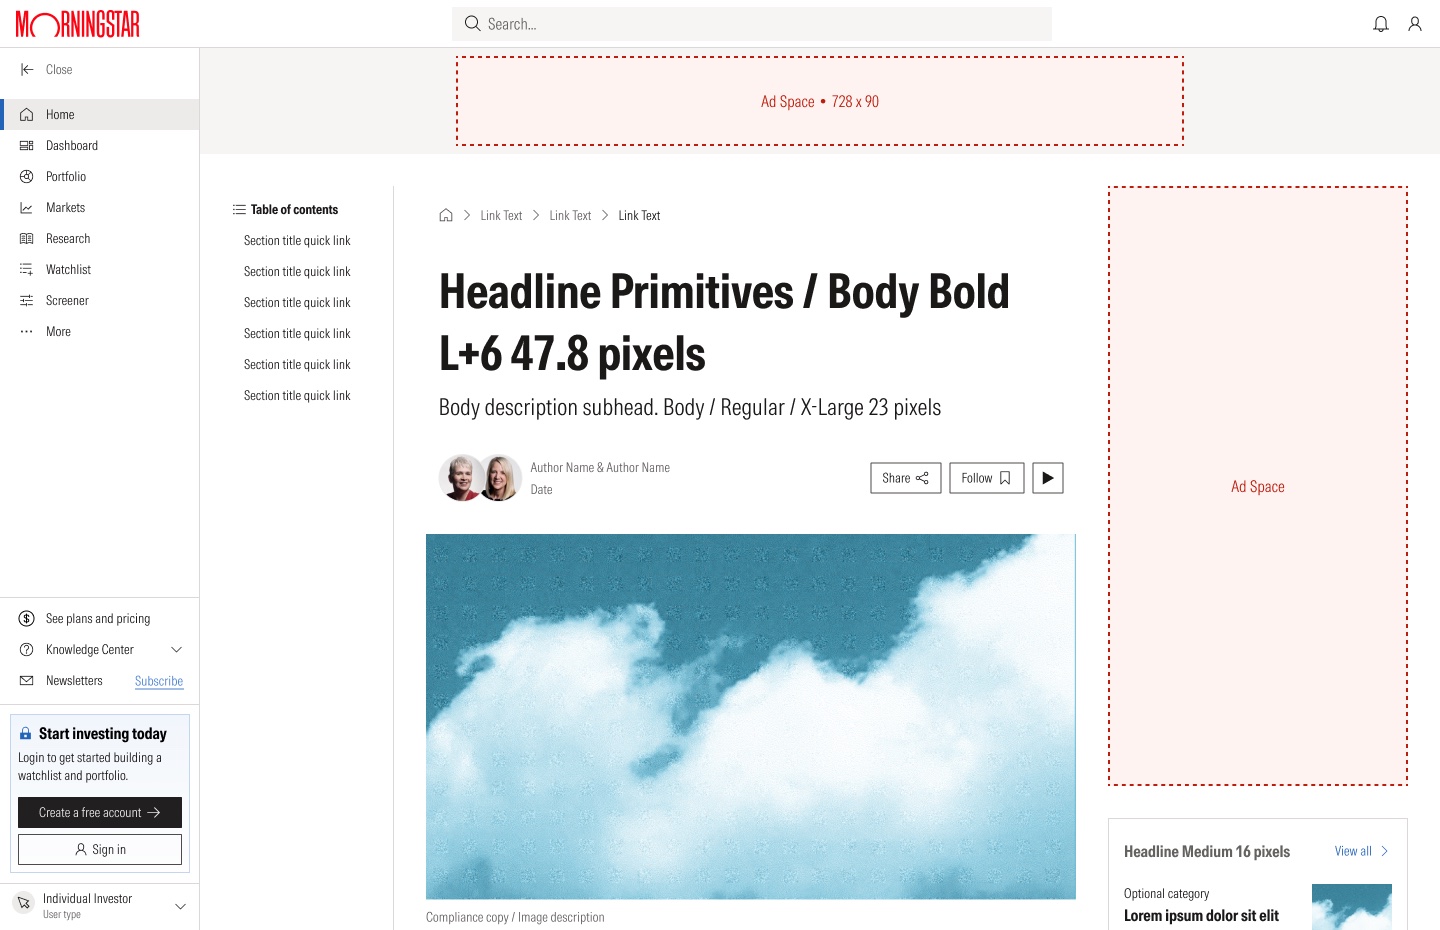
Article, visitorReady for development
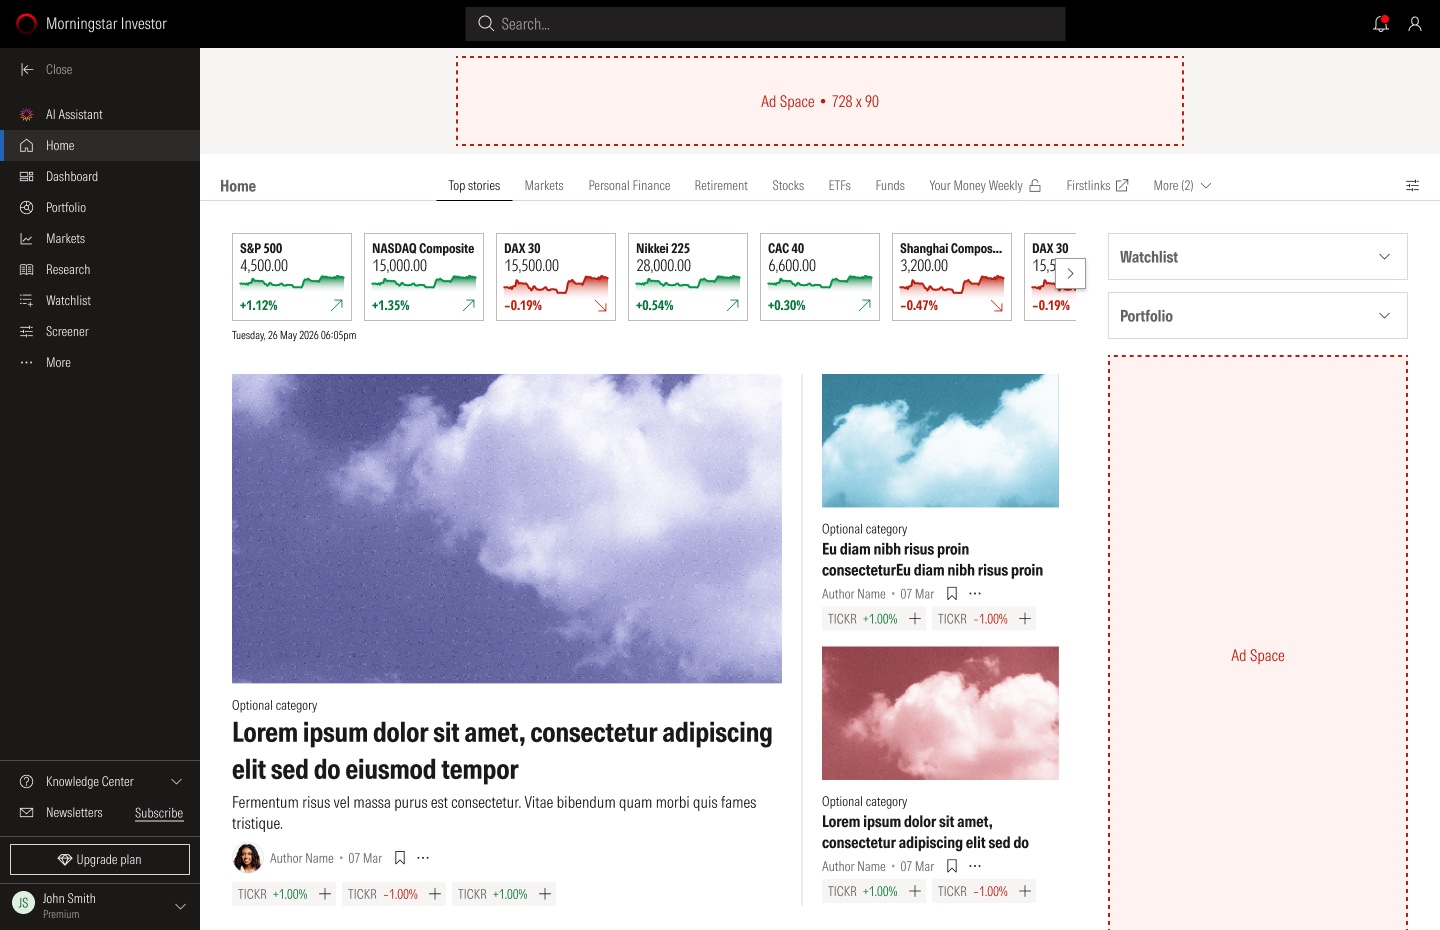
Home, PremiumDark header, AI assistant
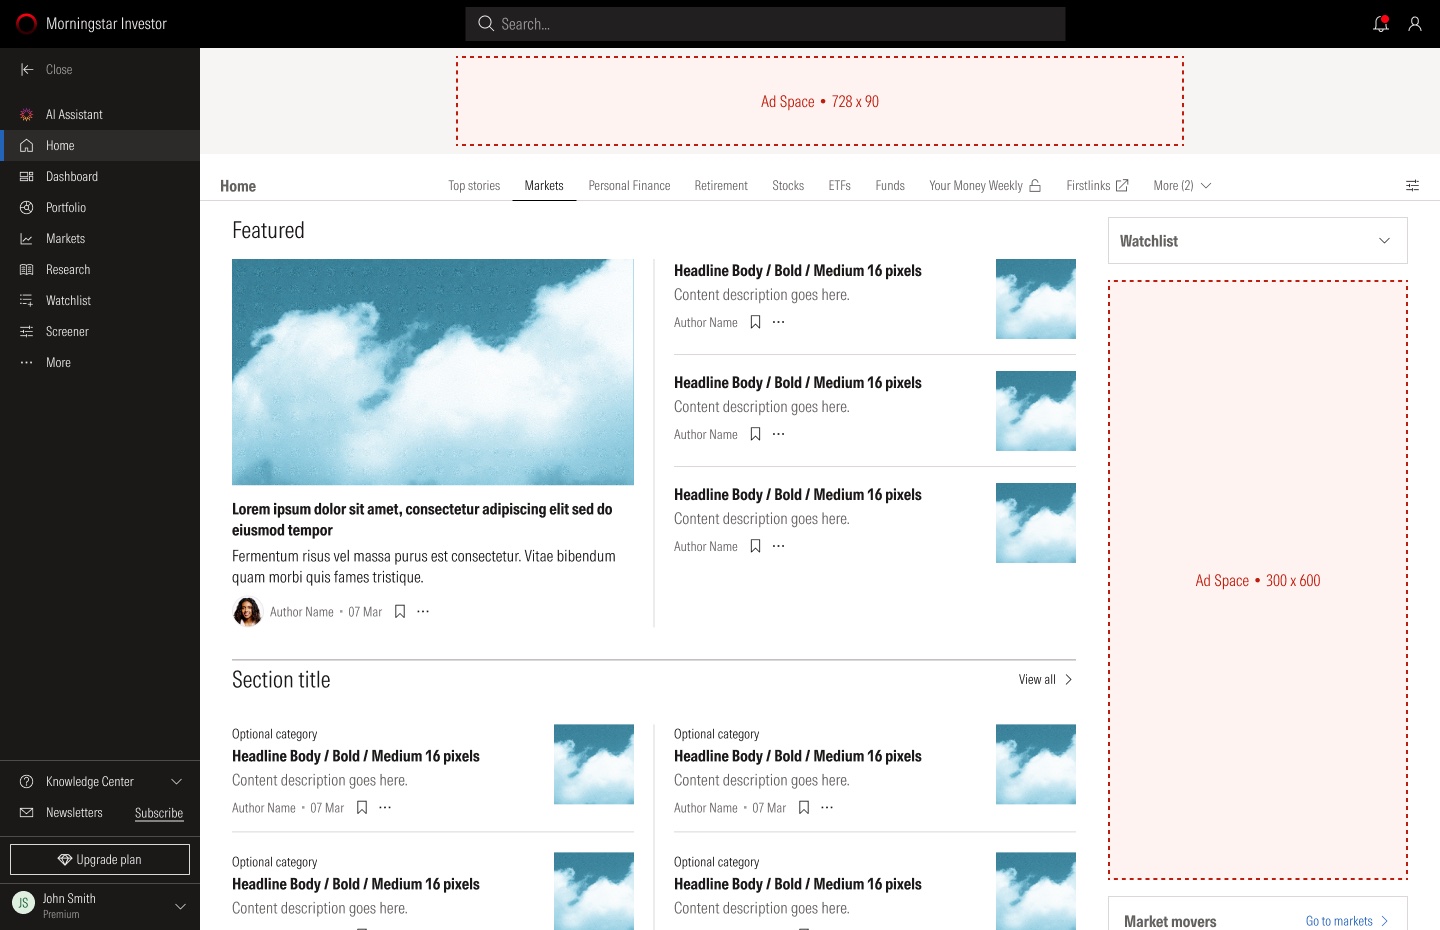
Markets, PremiumFeatured stories

Stocks, PremiumThe same layout, another topic
Adding investments
There are four ways to add investments to a watchlist: search, a saved screen, paste, or a file. The file import reports exactly what happened: everything added, some skipped as duplicates, or errors to fix.
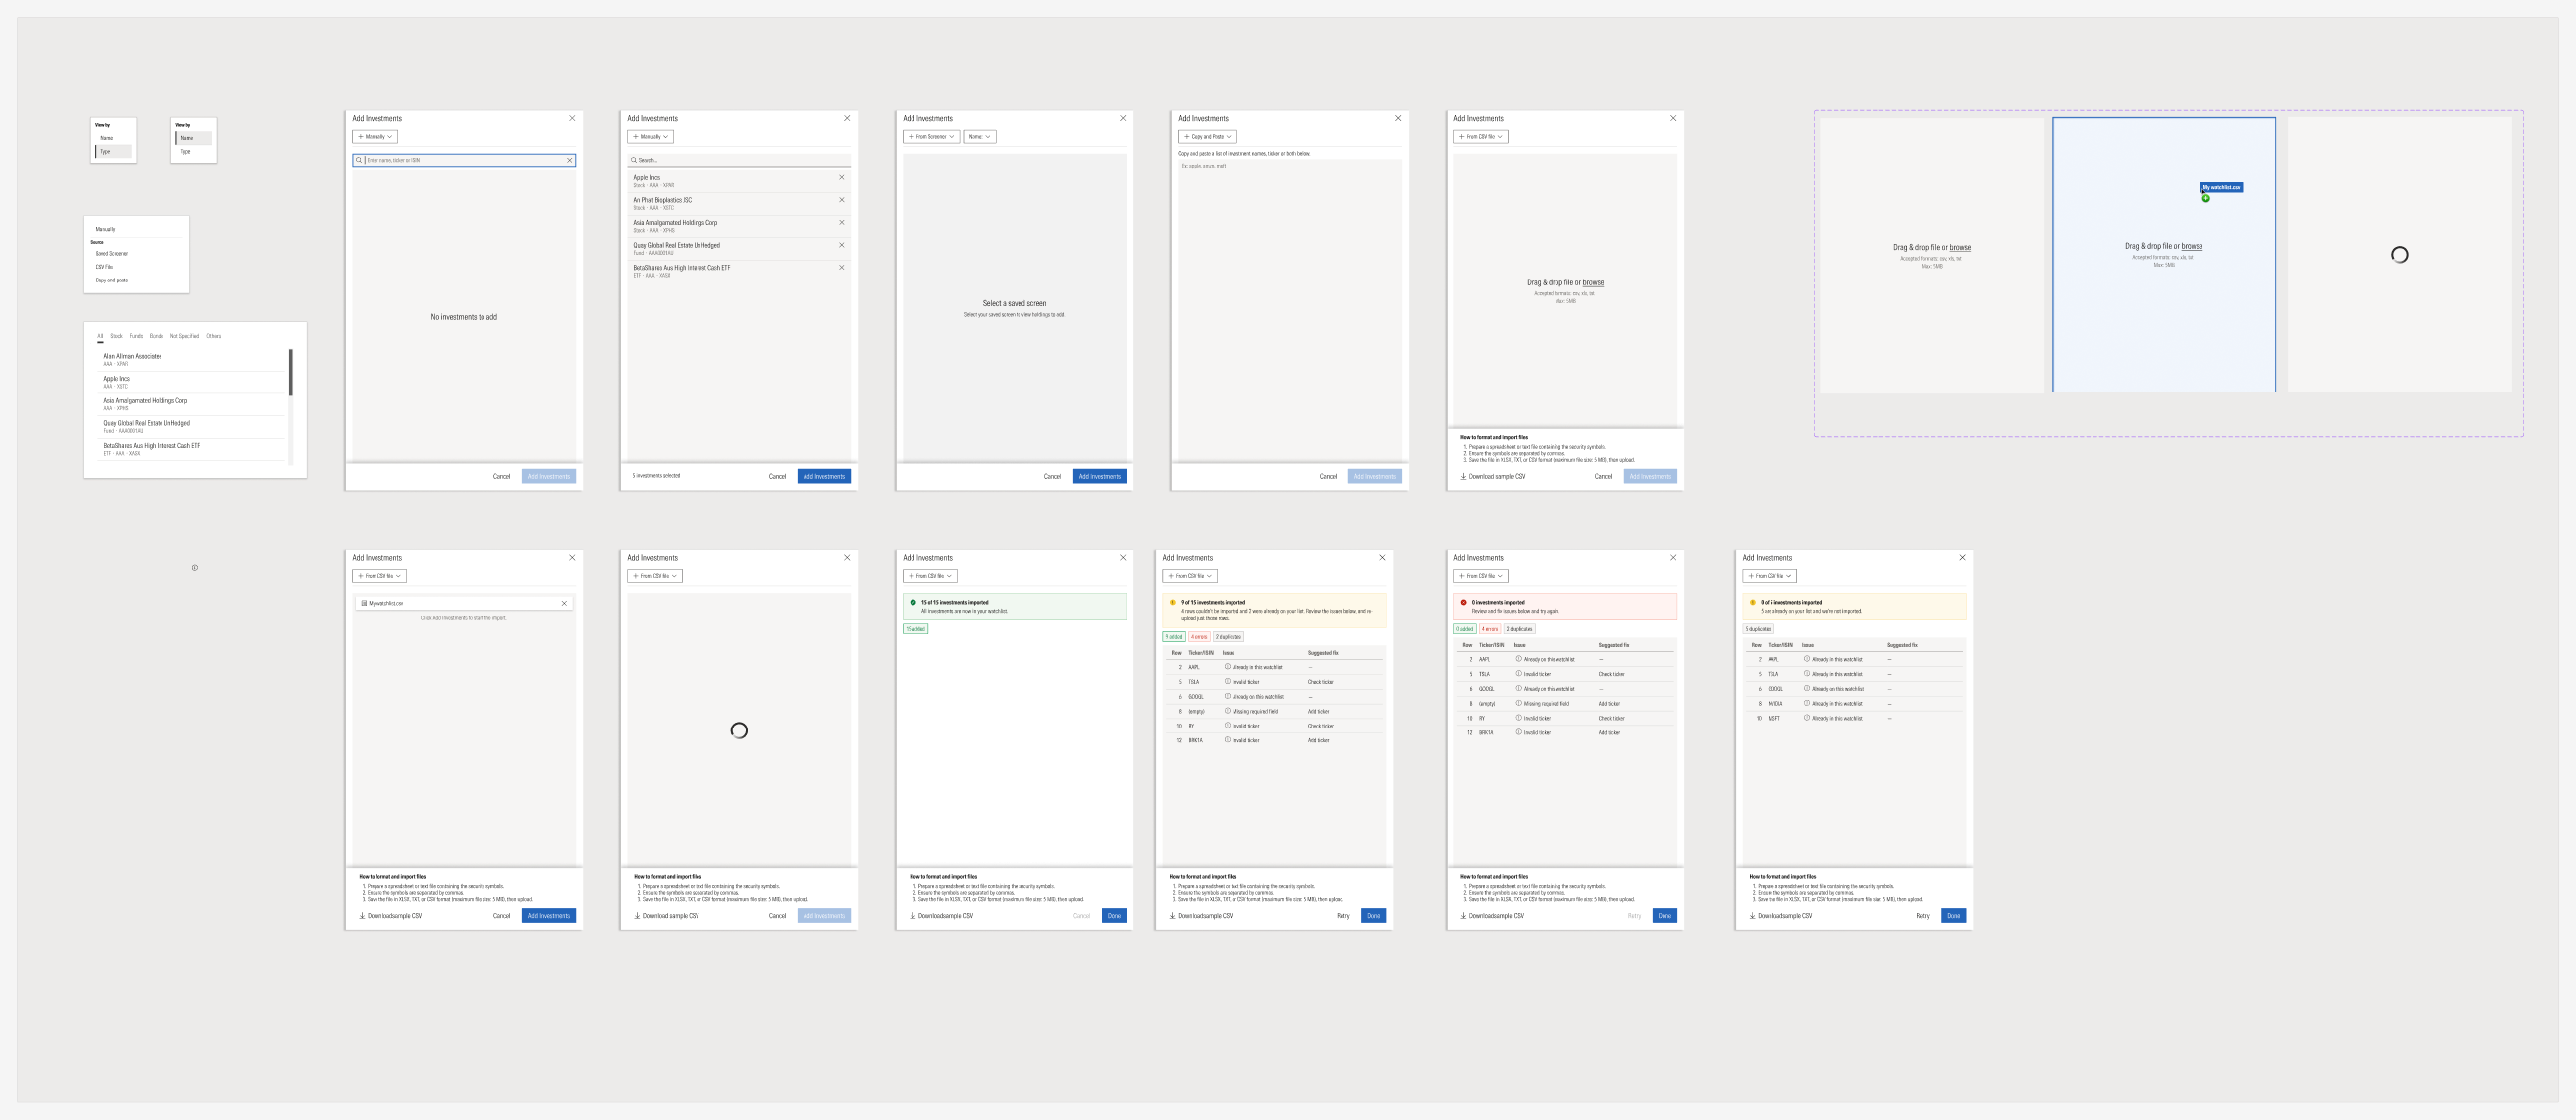
Compare
Investments can be compared in columns or in rows, and whole portfolios can be compared with each other.
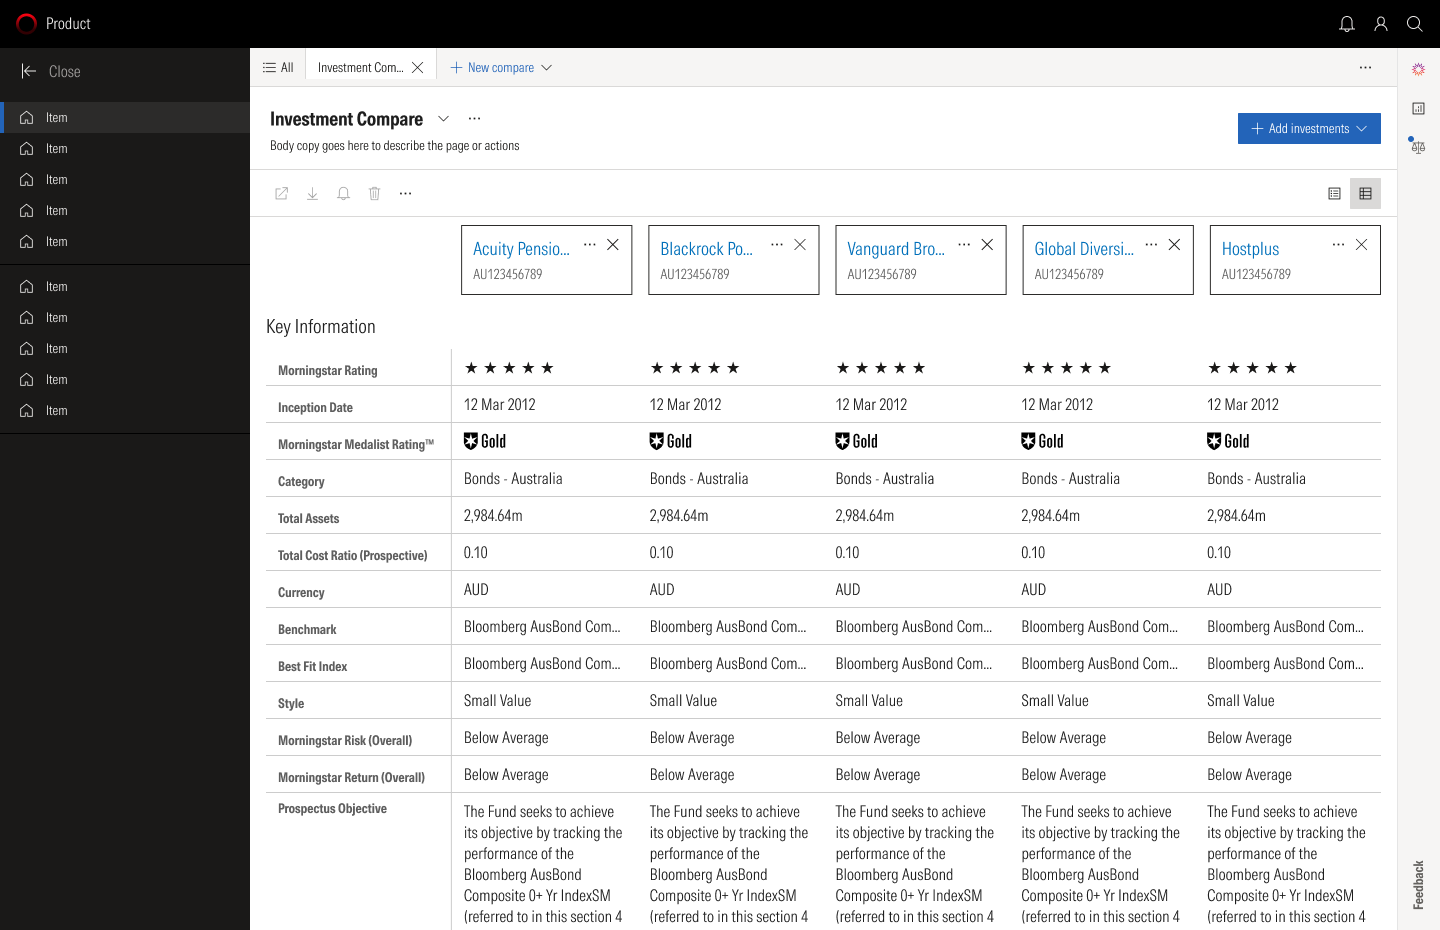
In columnsOne investment per column
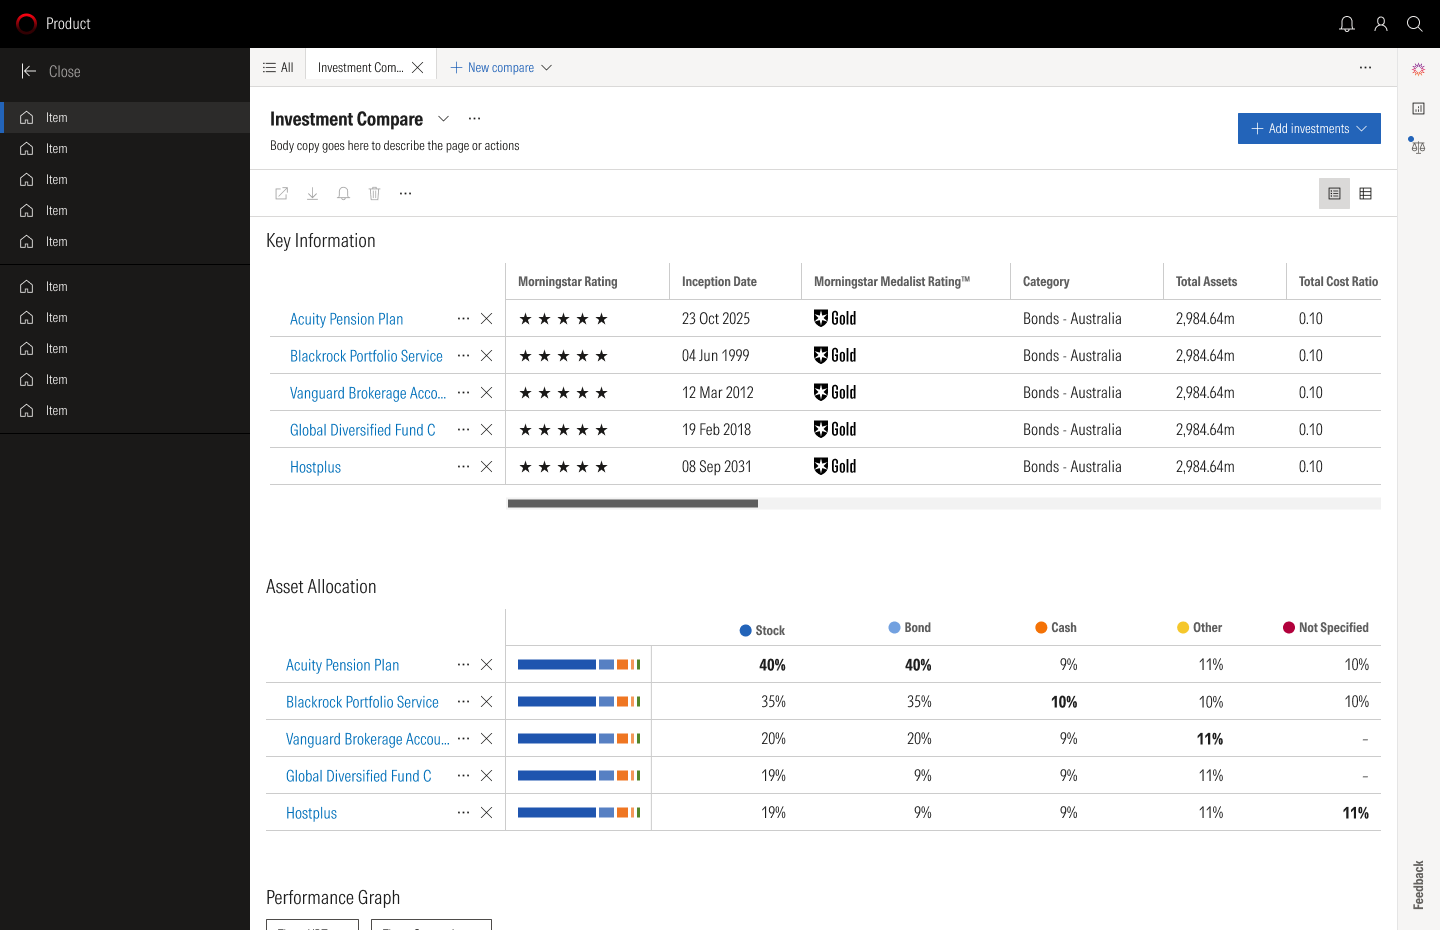
In rowsOne investment per row
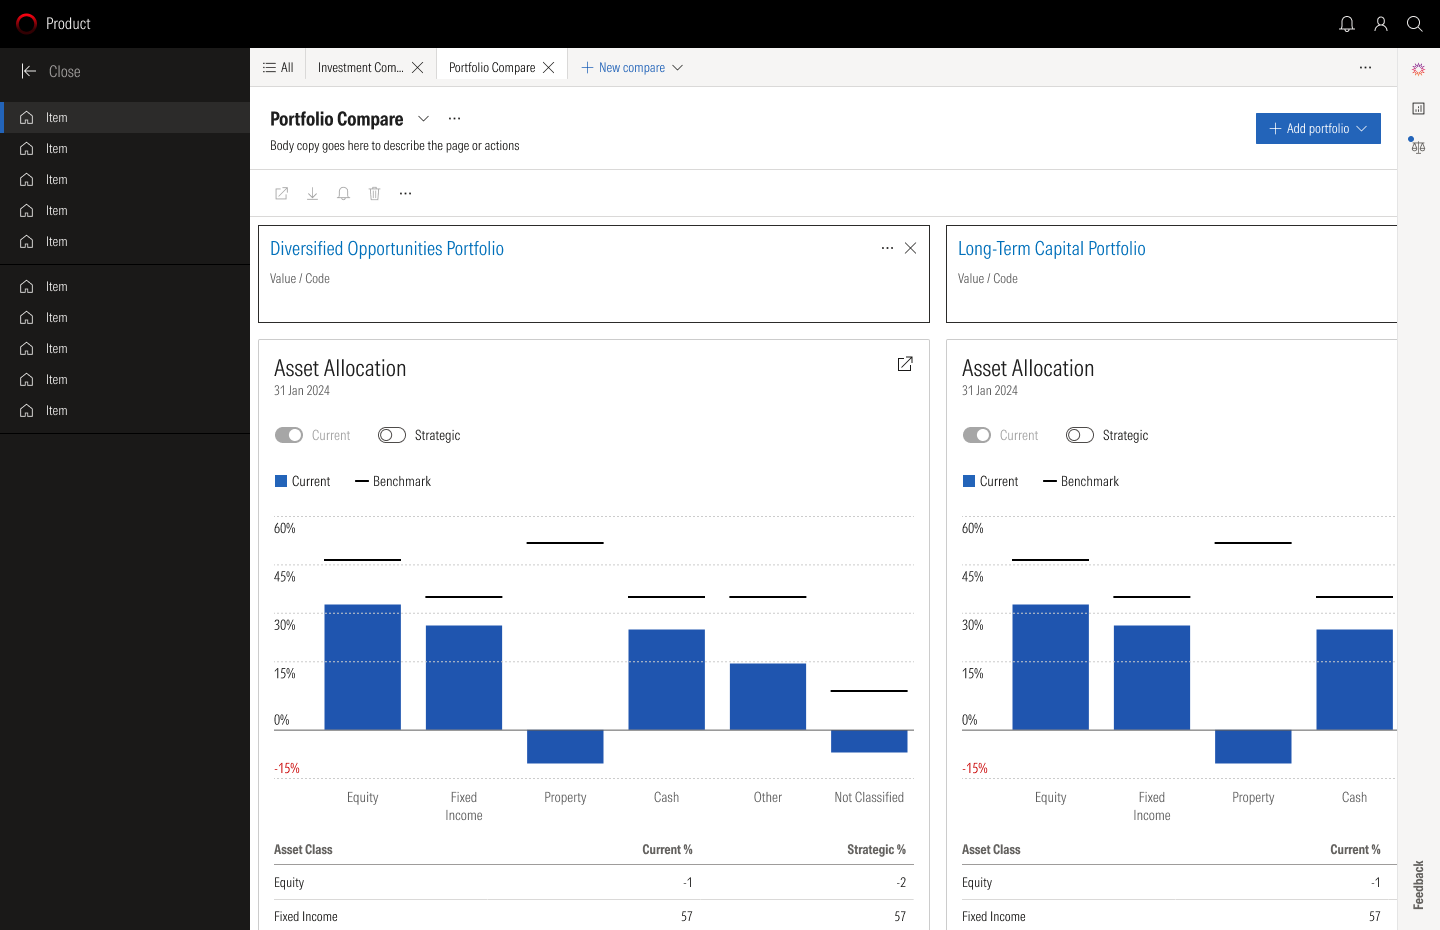
PortfoliosTwo portfolios side by side
Portfolio X-ray
The overview shows value, performance and holdings. X-ray looks inside: risk score, regions, asset allocation and returns. Holdings can be edited in a side panel without leaving the analysis.
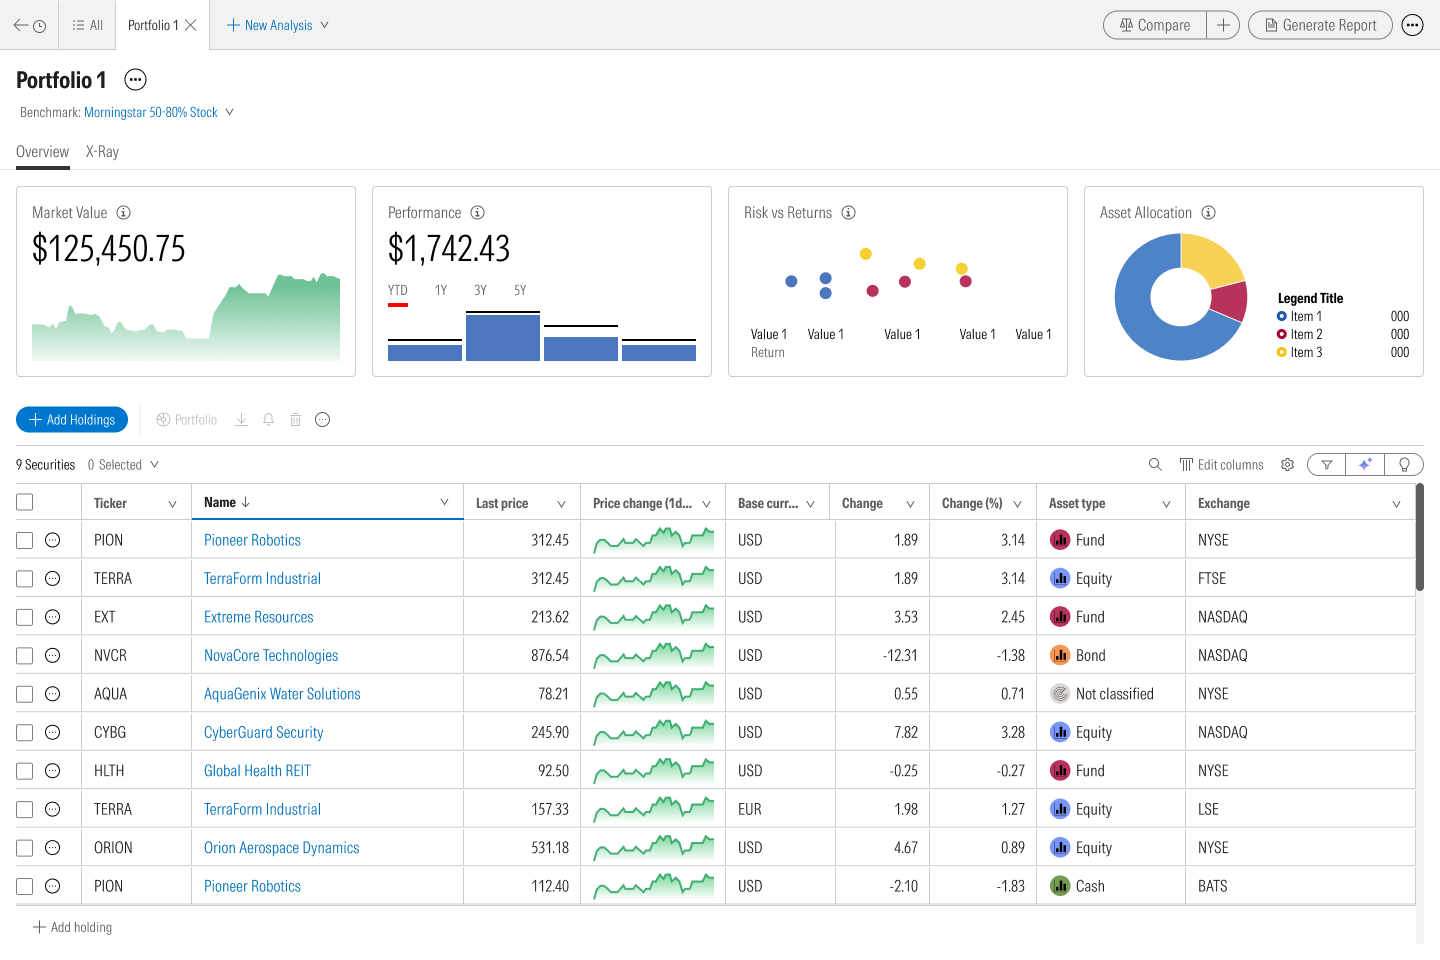
OverviewValue, performance, holdings

X-rayRisk, regions, allocation
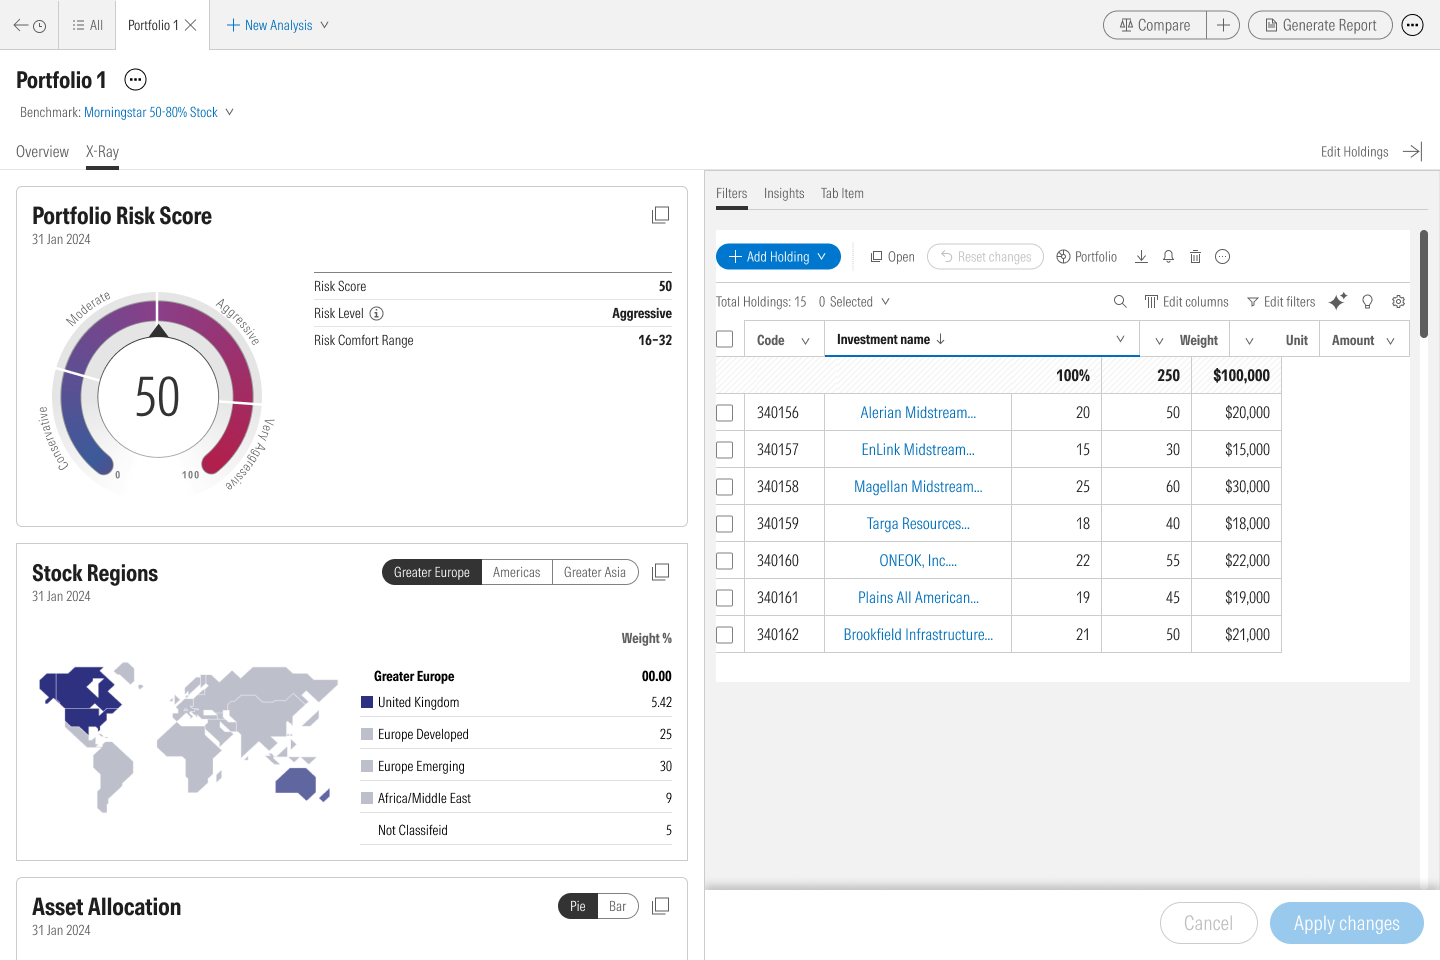
Edit holdingsIn a side panel
Inside the adviser's software
The same analysis runs inside the planning software advisers already use. It works across a client's accounts: one account, several side by side, or all of them combined.
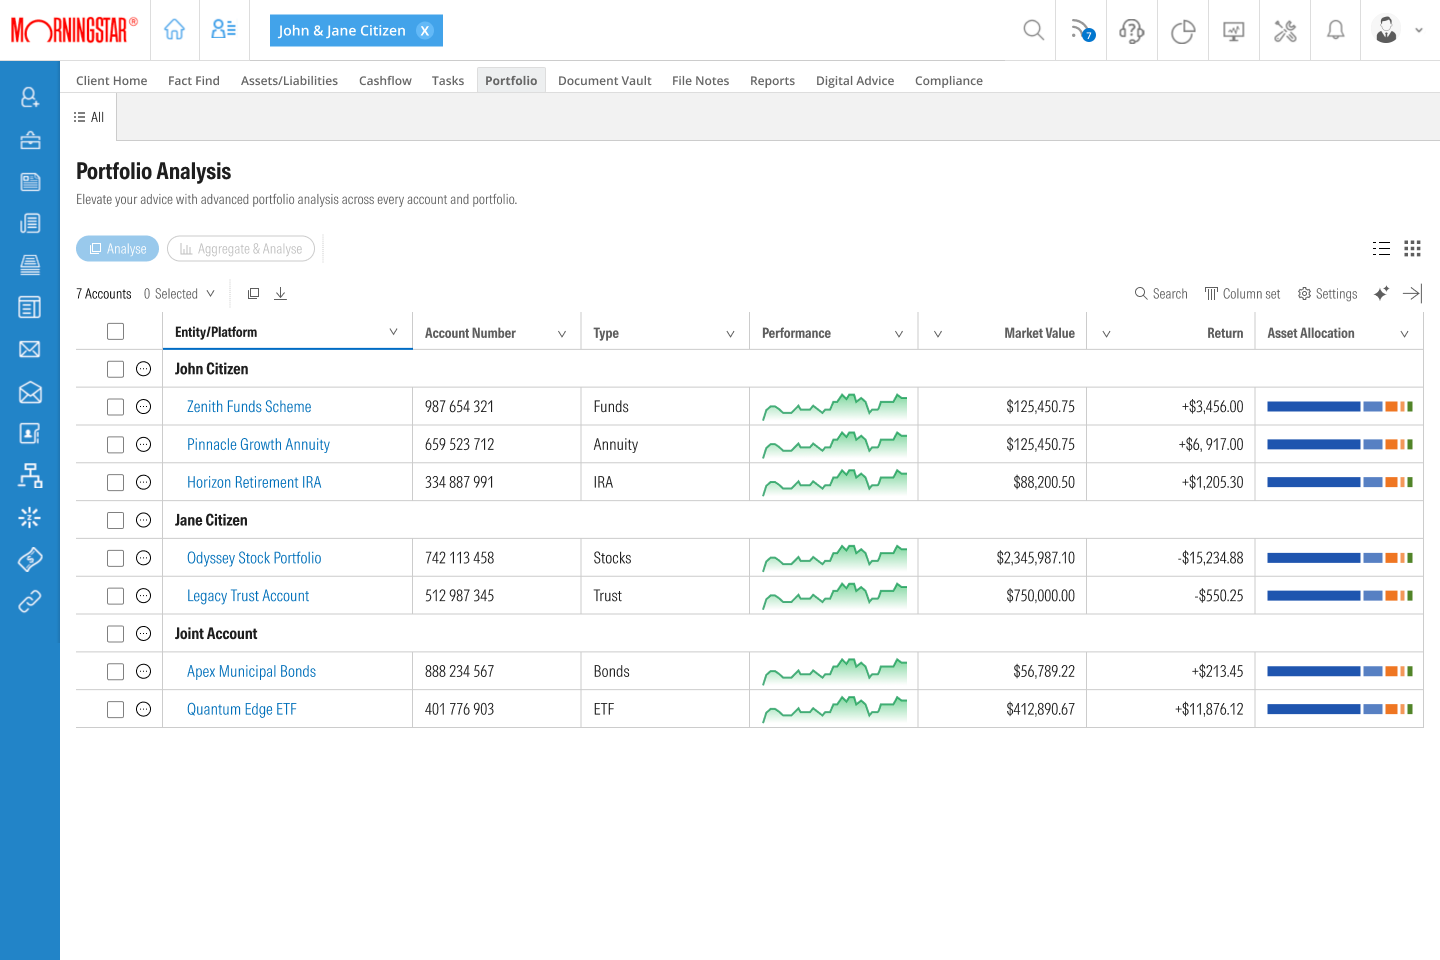
All accountsA client's accounts in one list
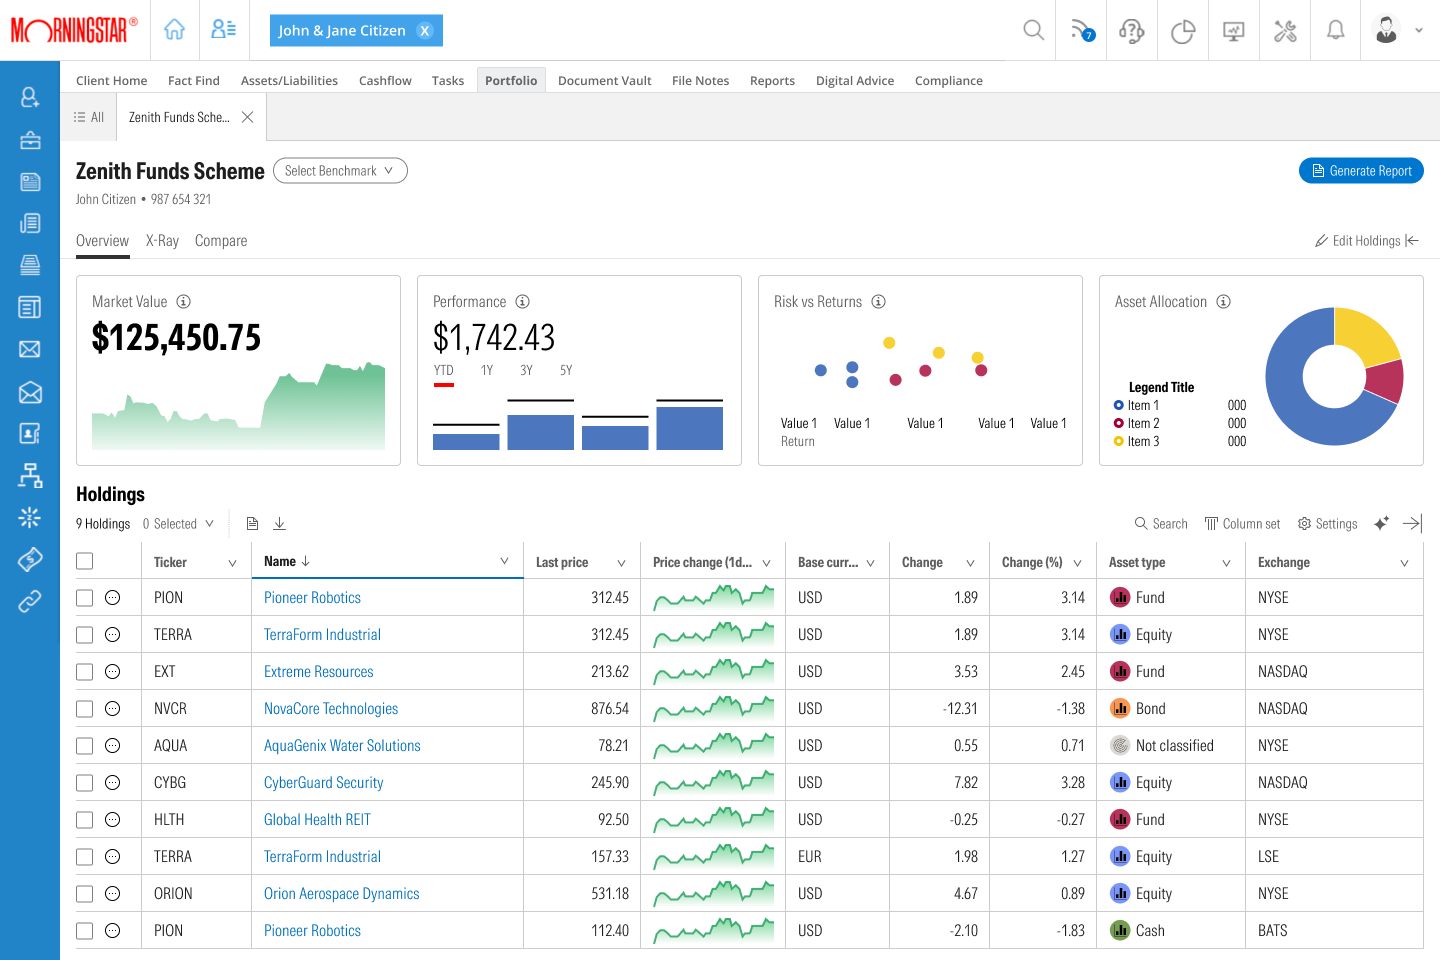
One accountOverview and holdings
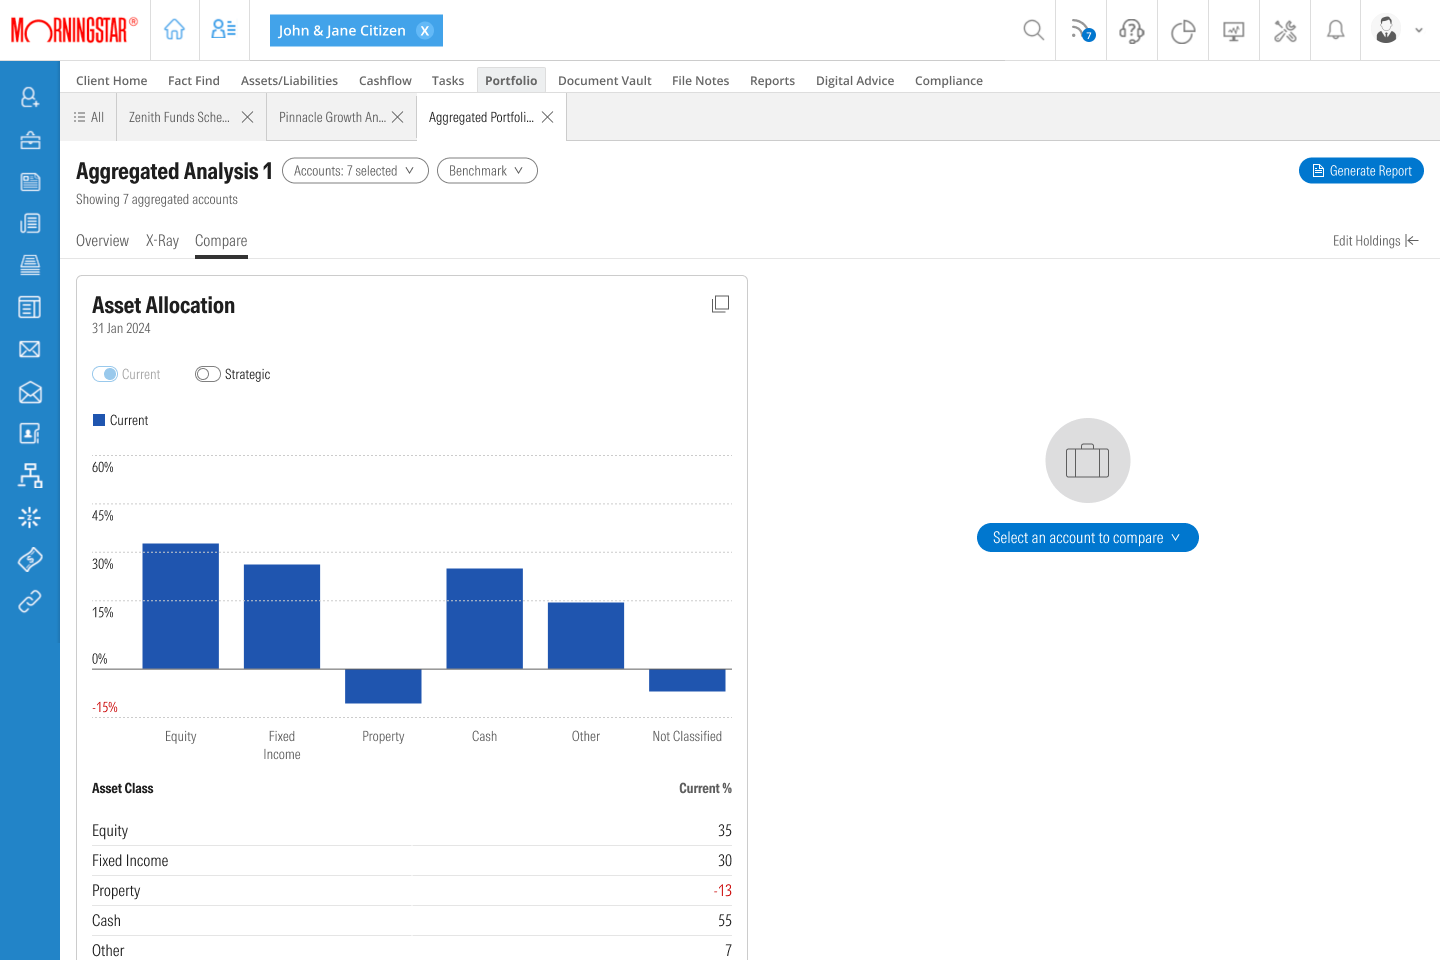
CombinedSeveral accounts, compared
Navigation
One navigation serves every level, as a full panel, a collapsed rail and a bottom bar on a phone. The More menu lists what each plan unlocks, so the navigation also explains the product.

Visitor and FreePanels, tabs and prompts
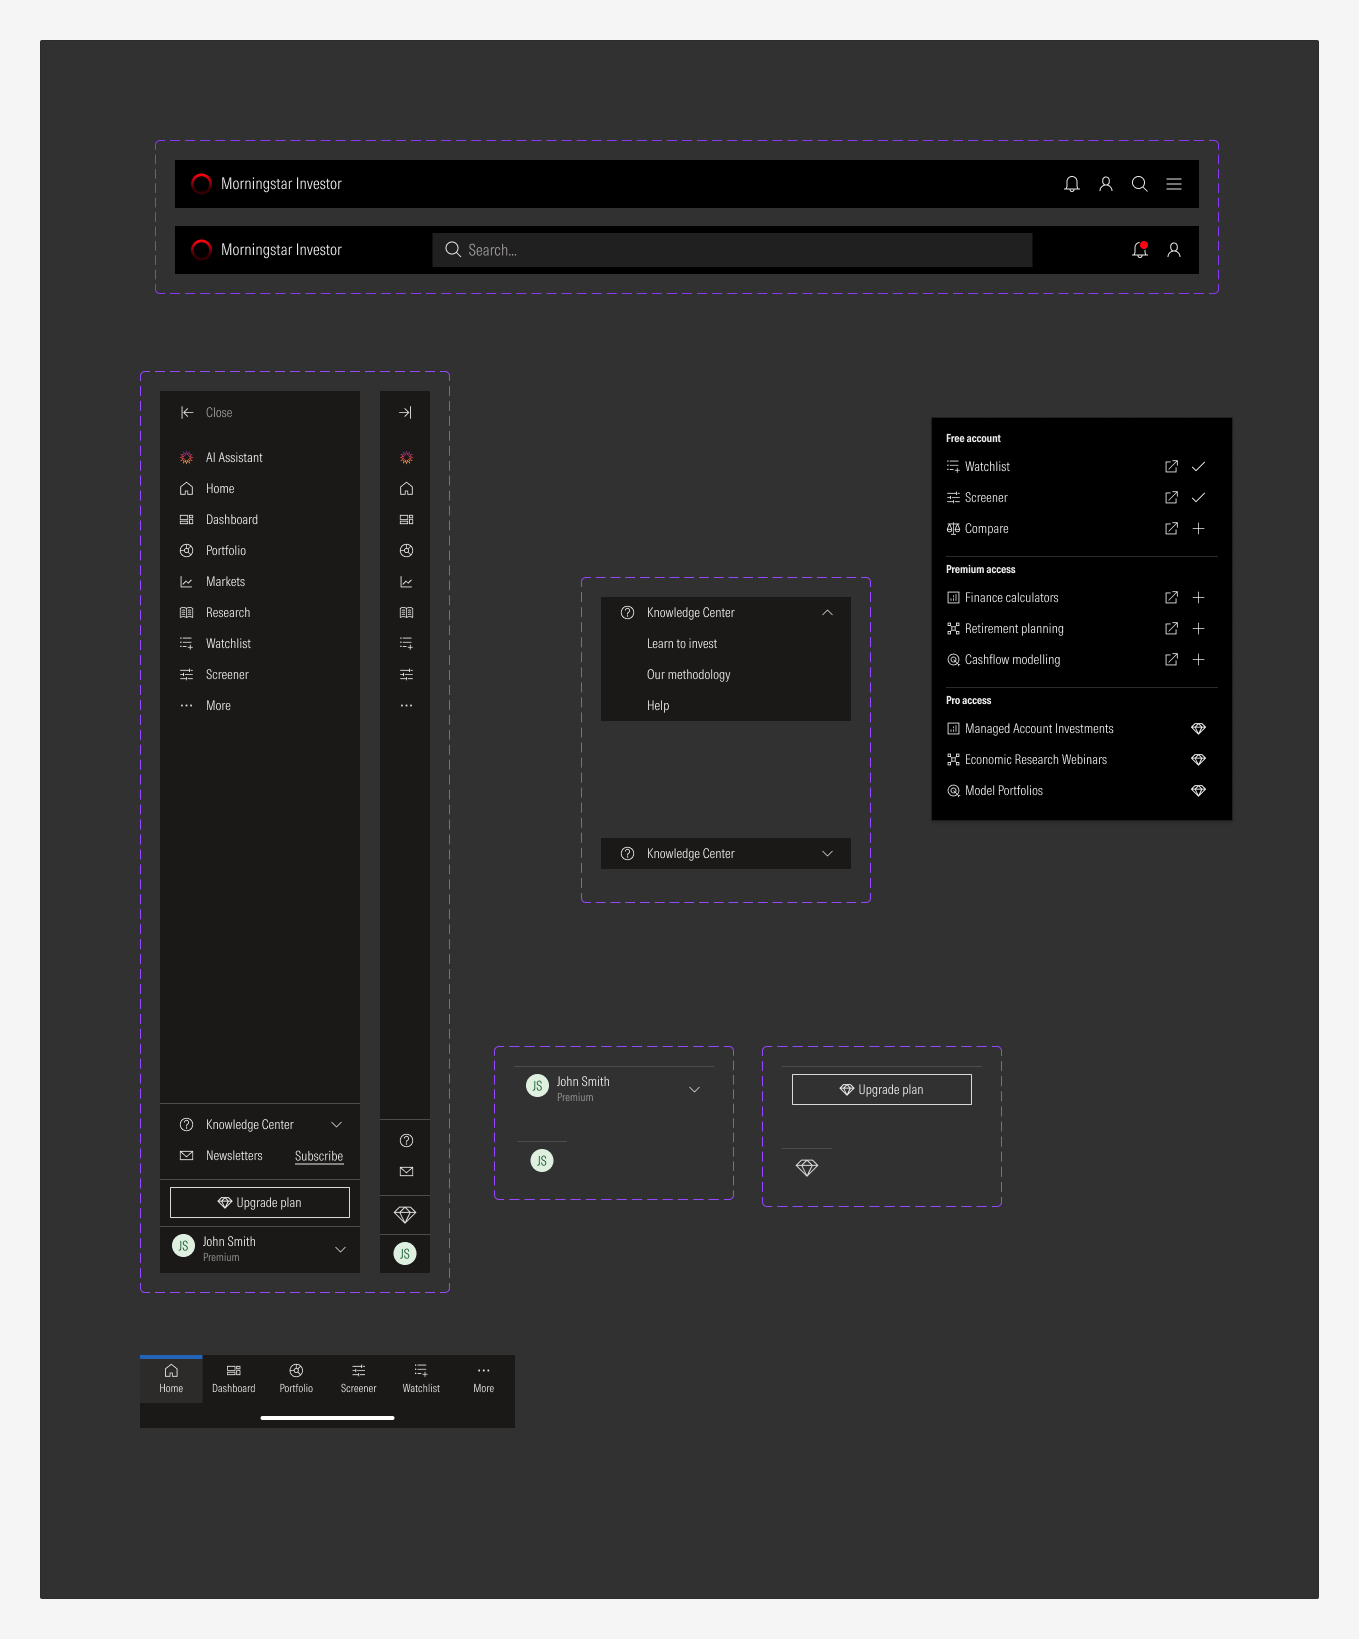
PaidPanel, rail, More menu, bottom bar
Small screens
Pages and tools are designed at three sizes. On a phone the side panel becomes a bottom bar, and tables keep their key columns and scroll sideways for the others.
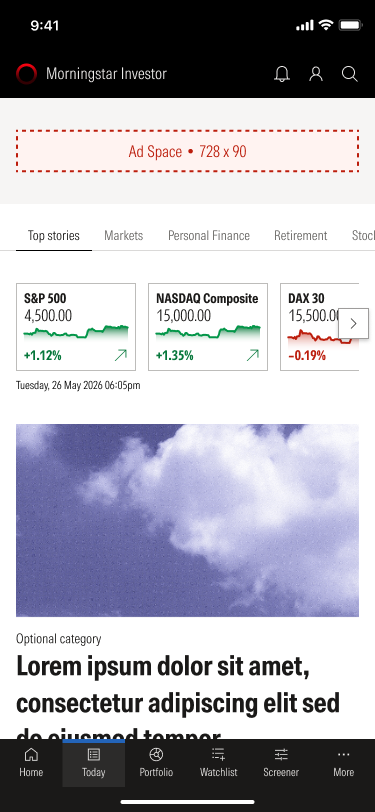
Home
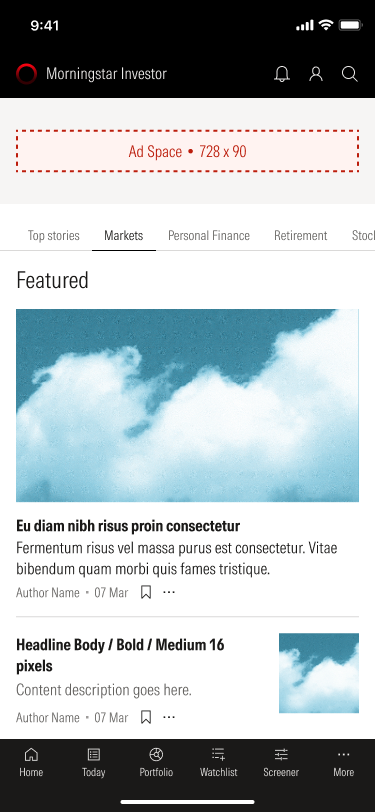
Markets
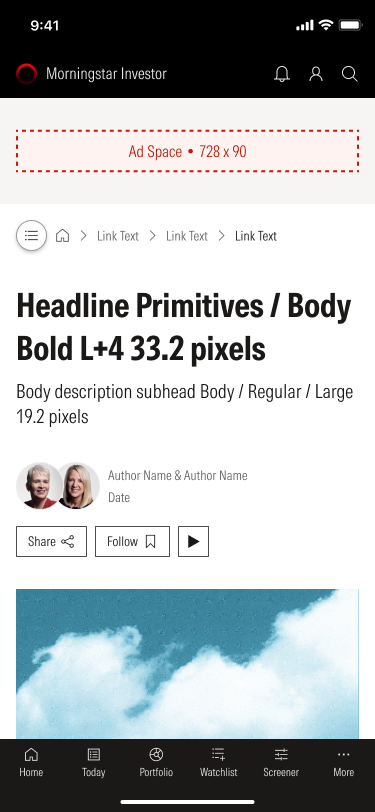
Article
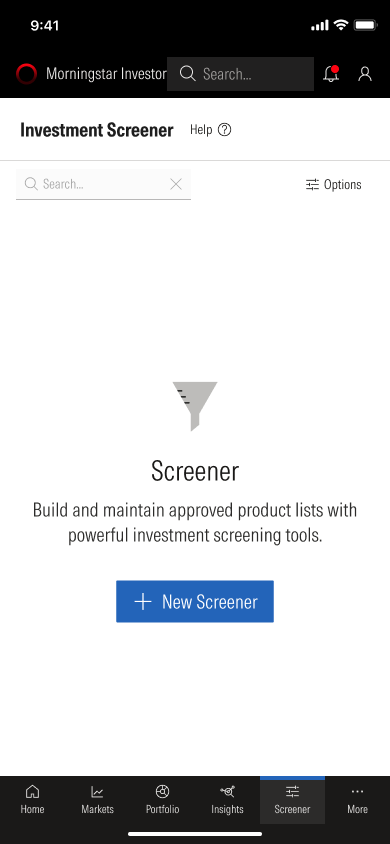
Screener
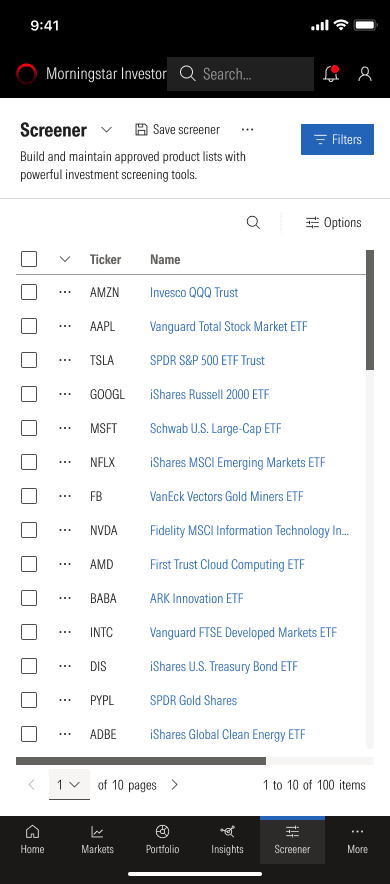
Screener results
Built as a system
Every screen is assembled from one library: charts, tables and editorial blocks, plus the parts each tool is built from, such as the Screener's filter sets and slide-outs, the Watchlist's panels, and the navigation menus. That makes five levels affordable to build and maintain, because the difference between levels is configuration and not new design.
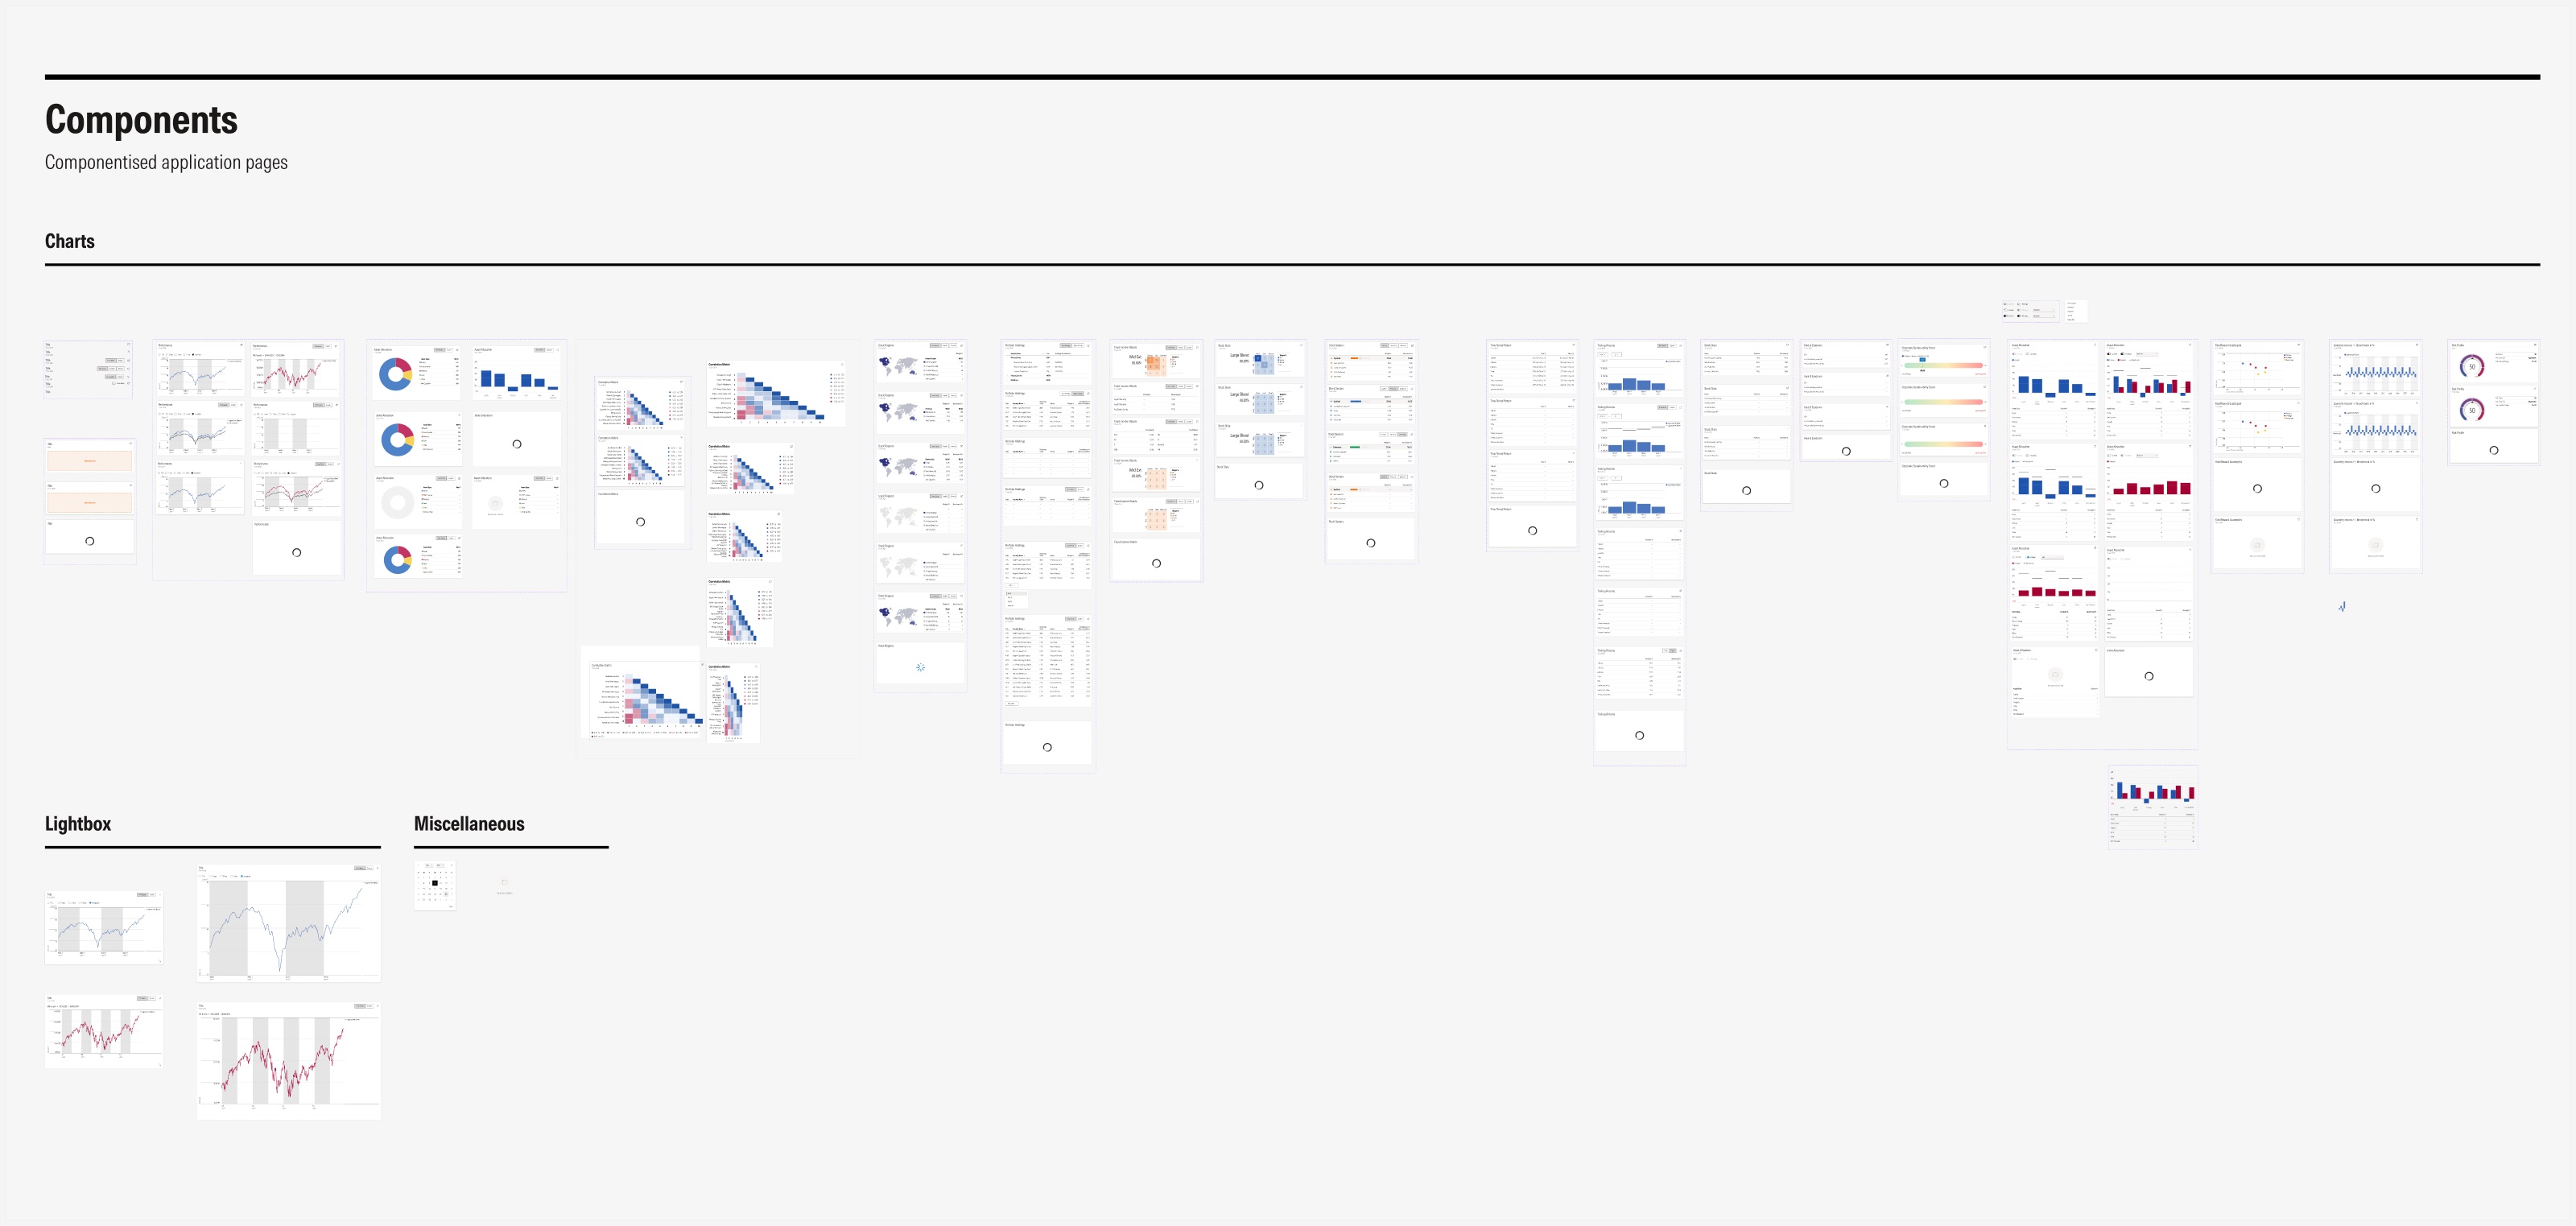
ChartsEvery chart, in every state
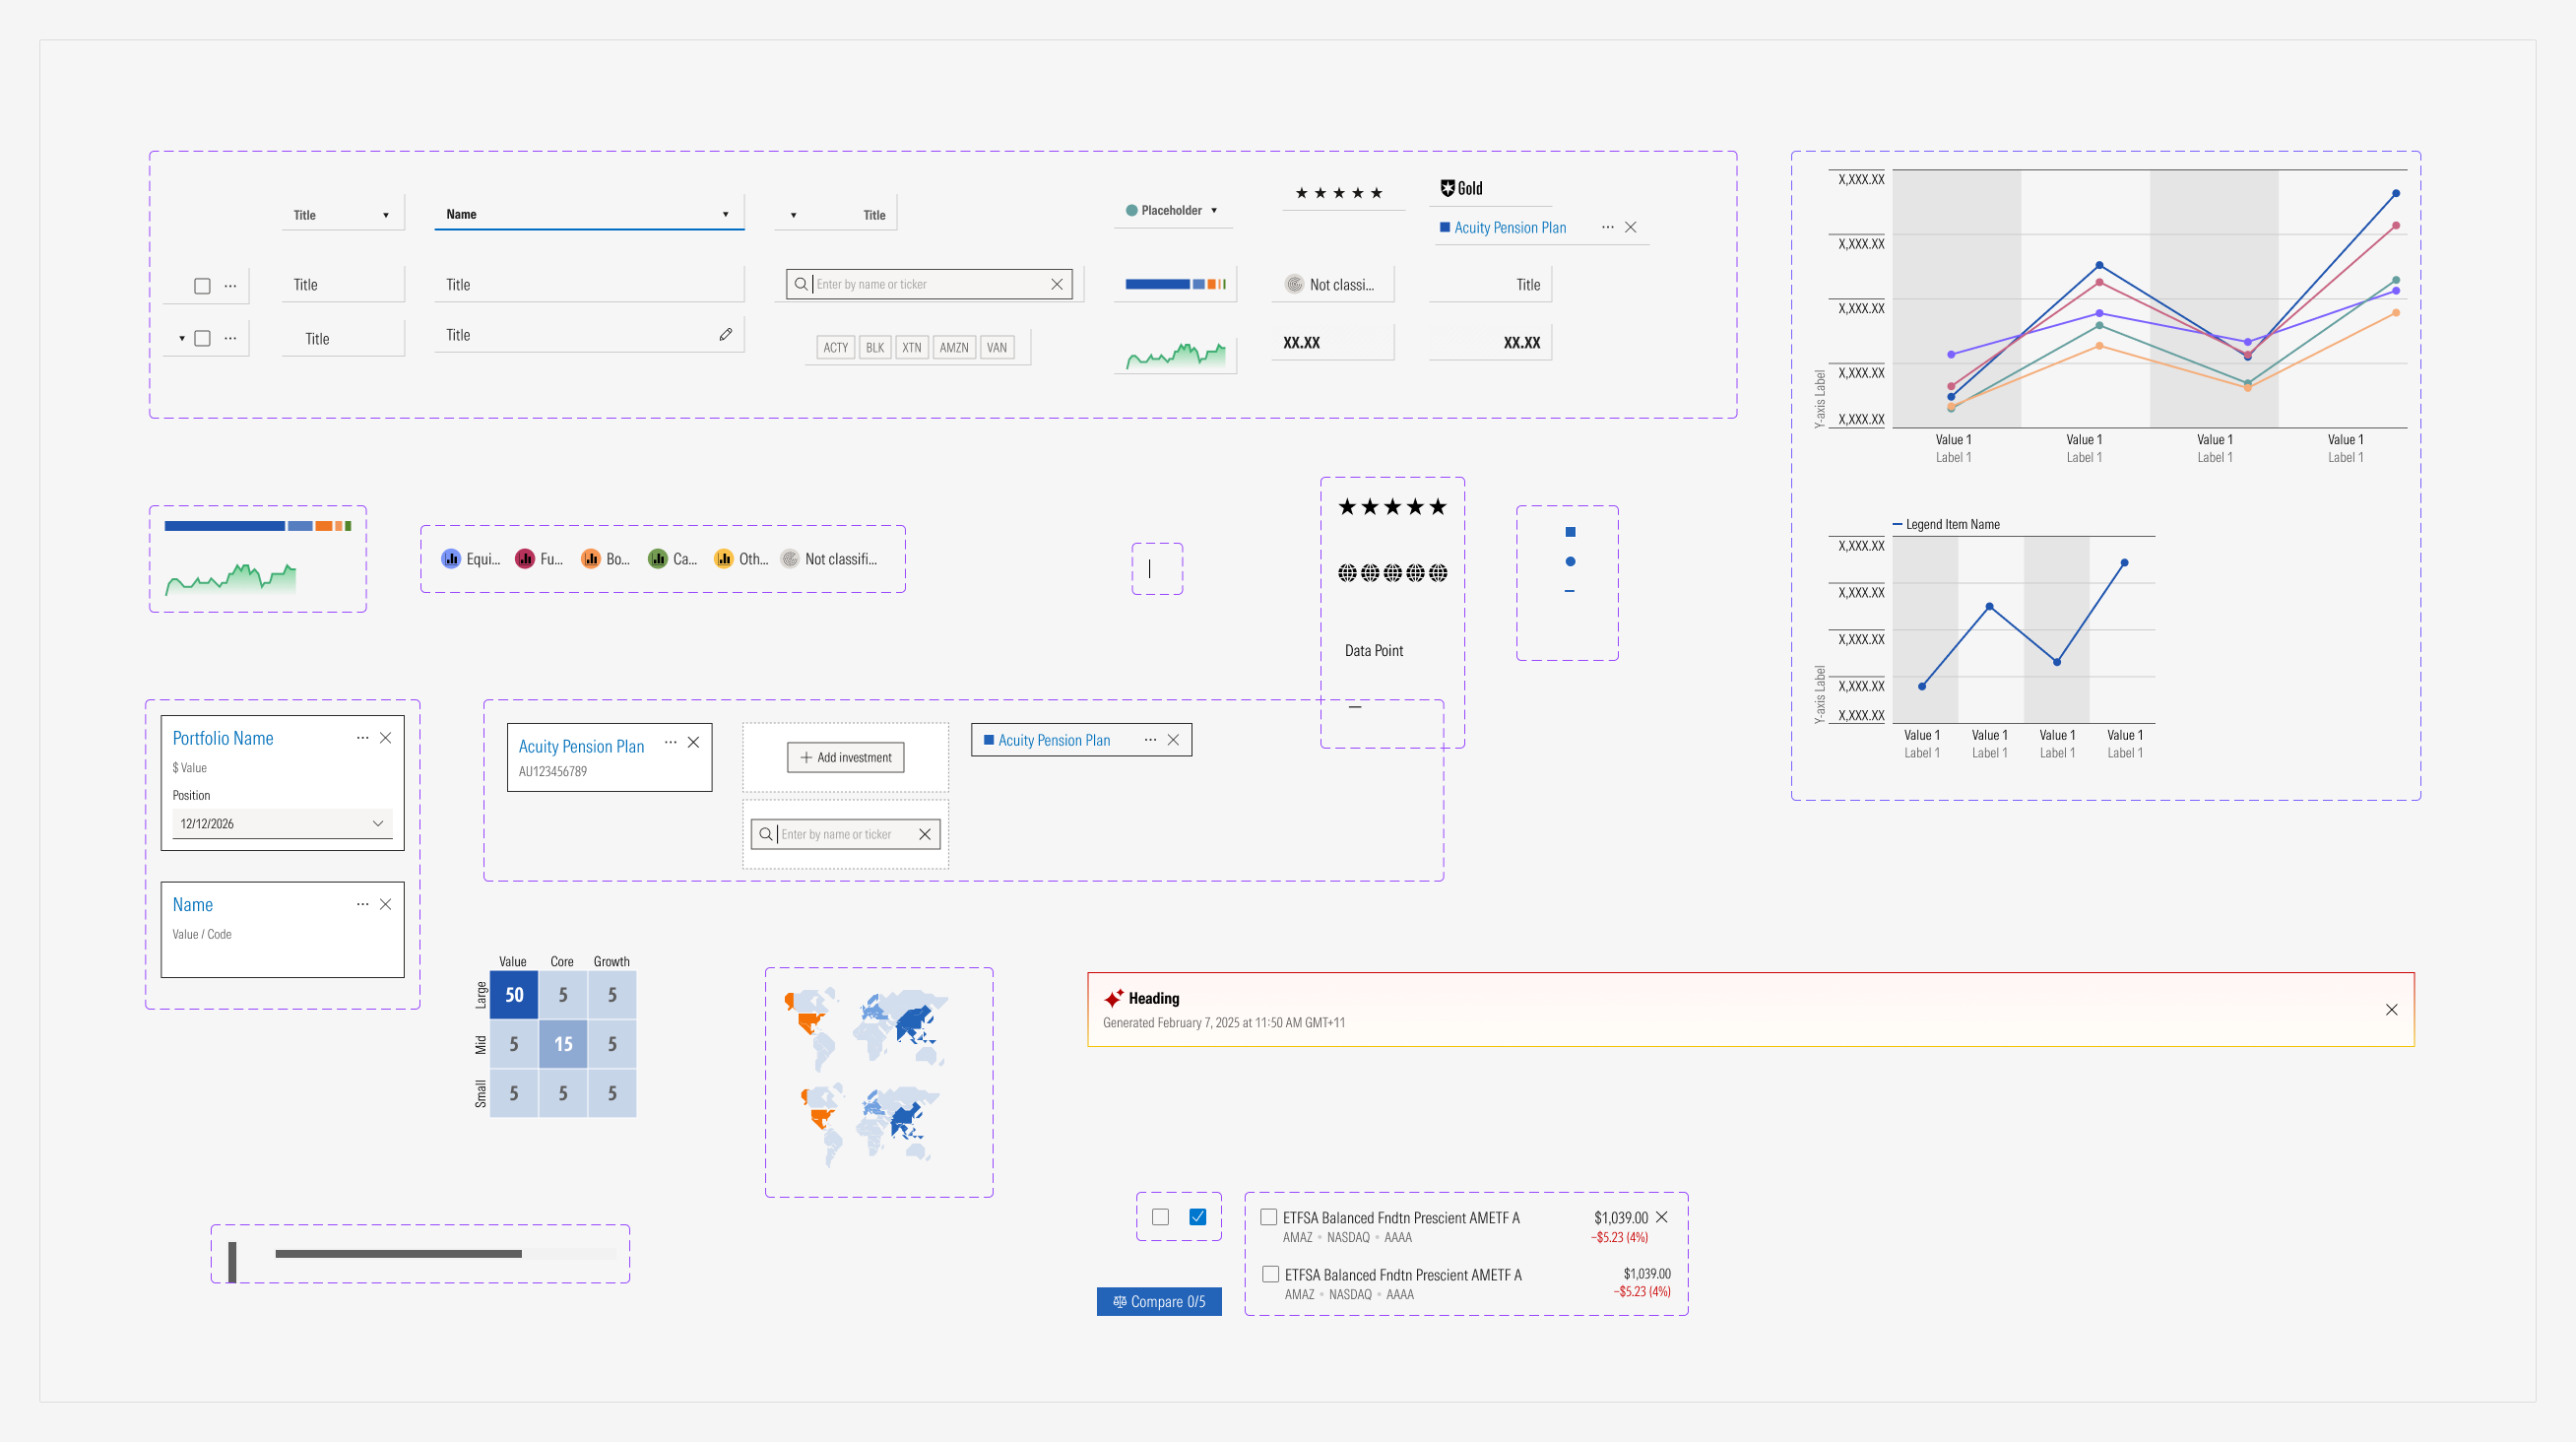
Tool componentsCells, tags and cards
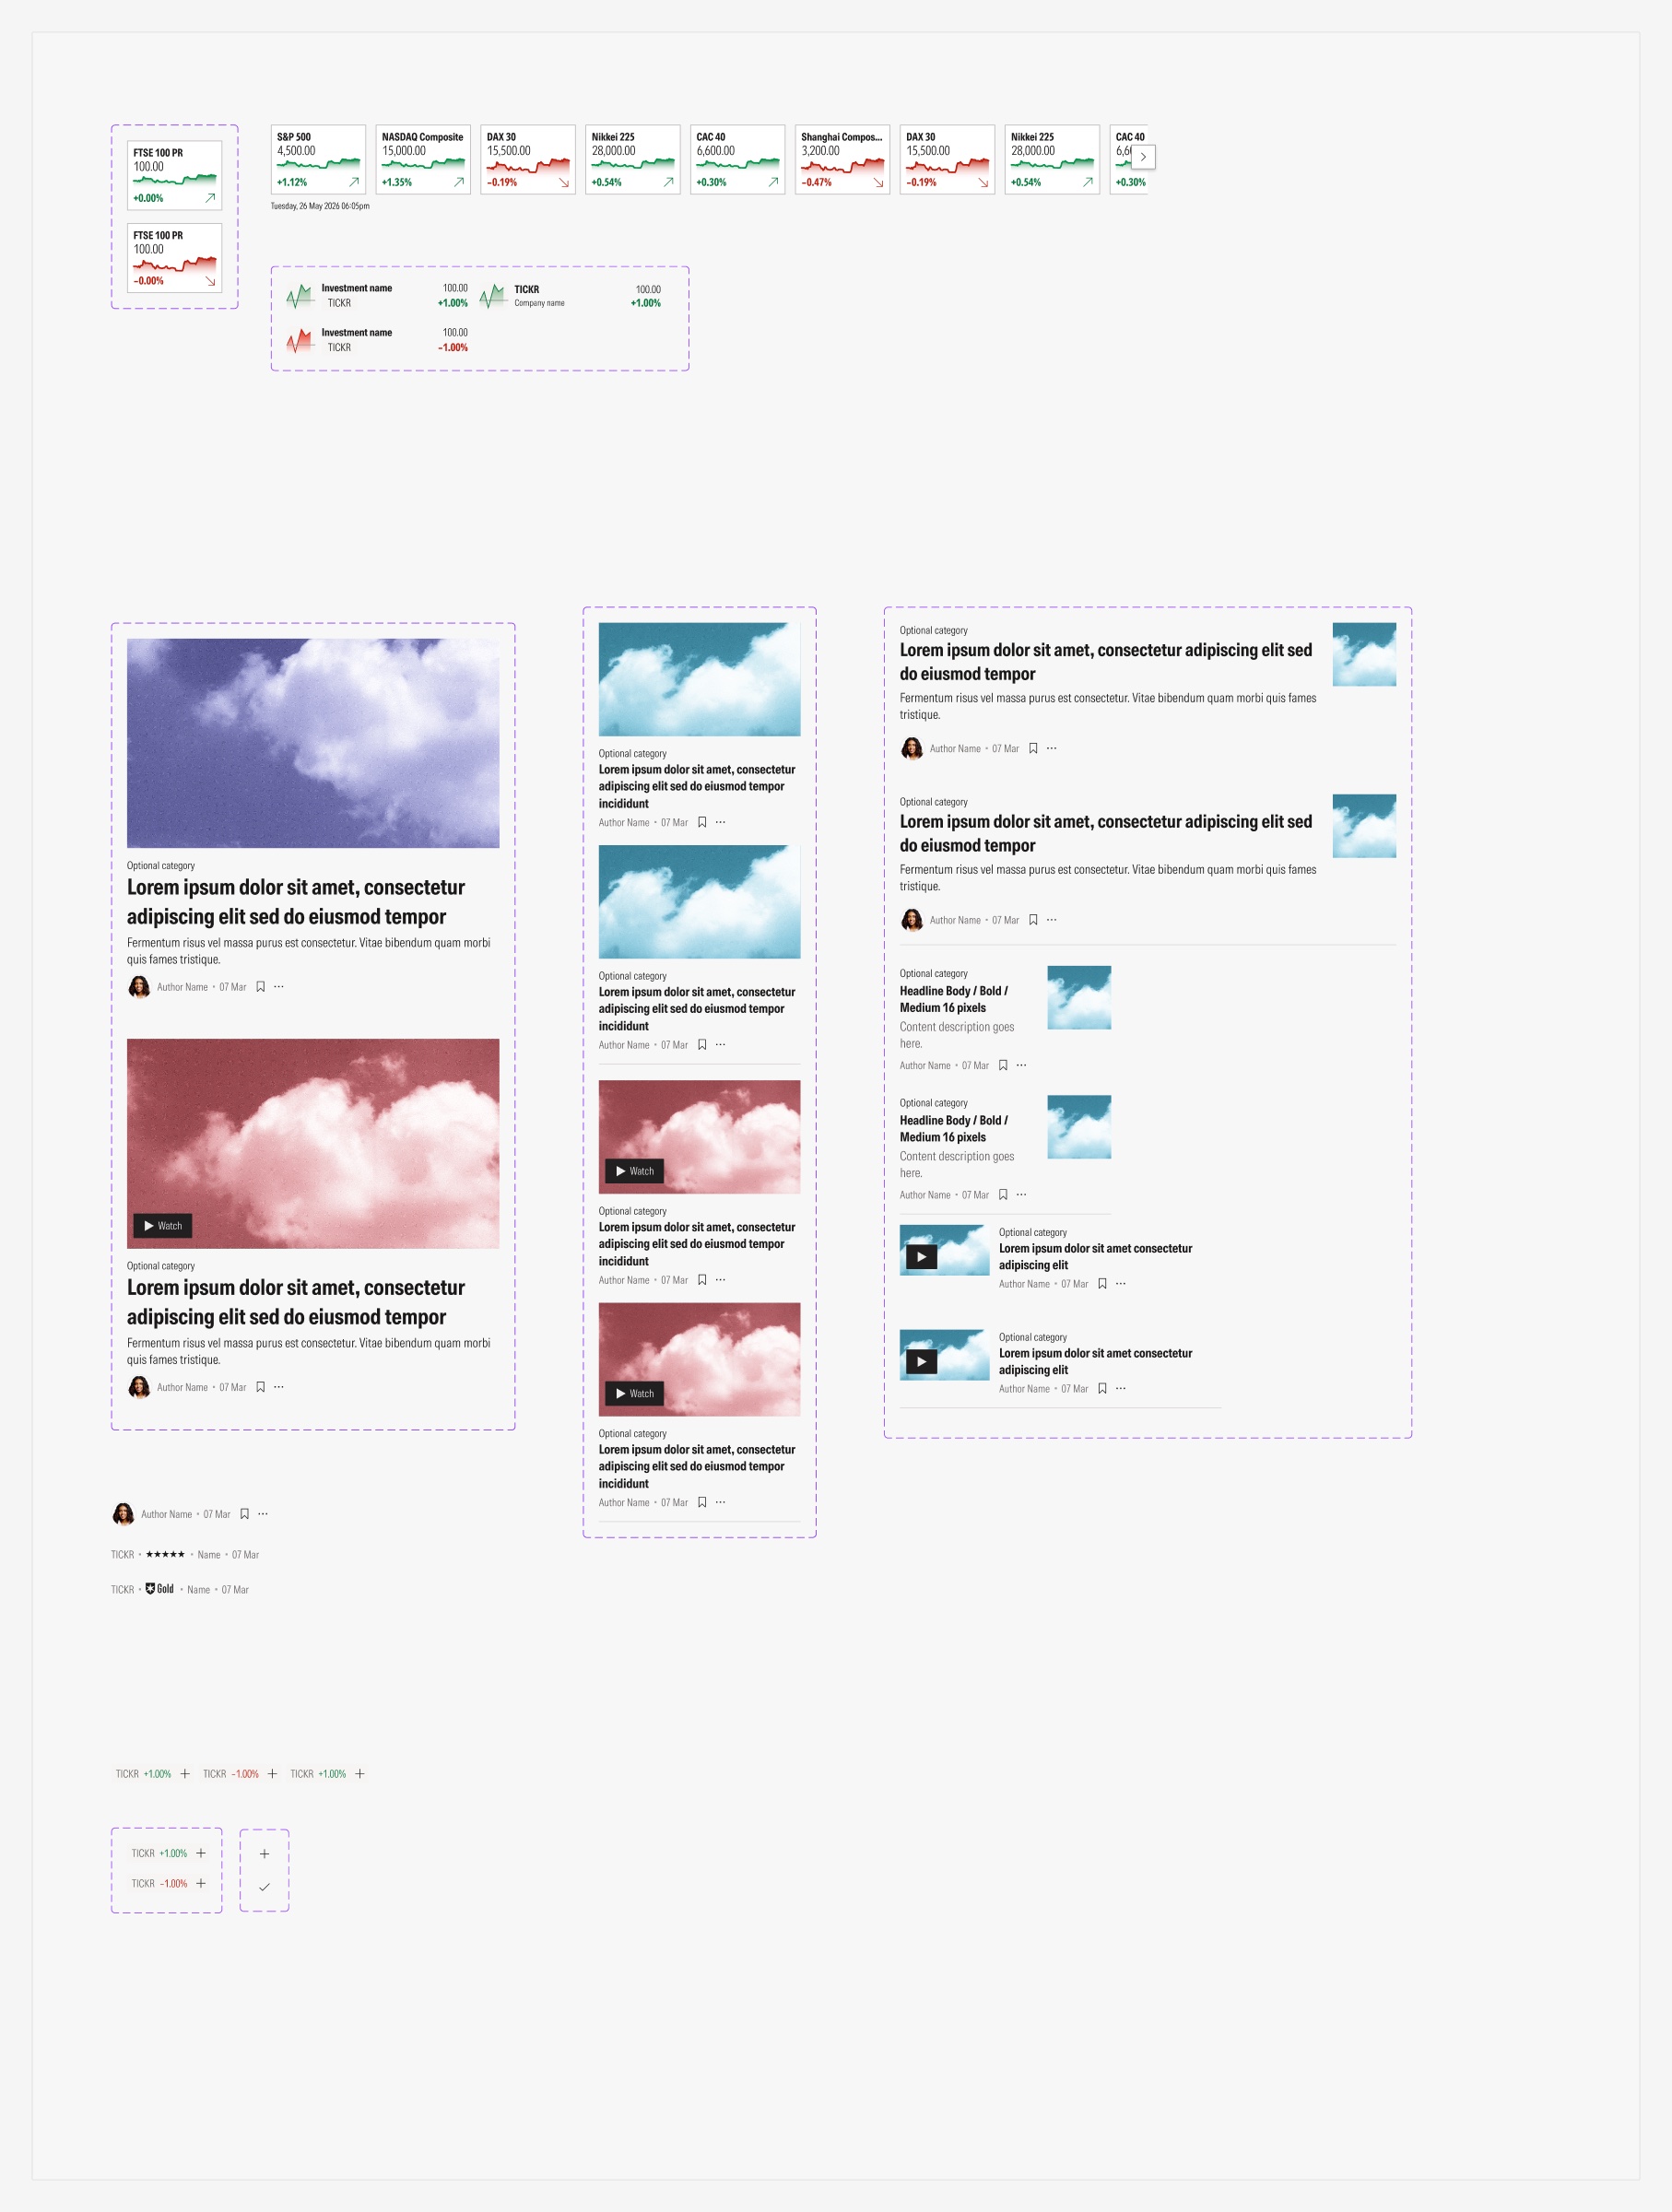
Editorial elementsHeadlines and tickers
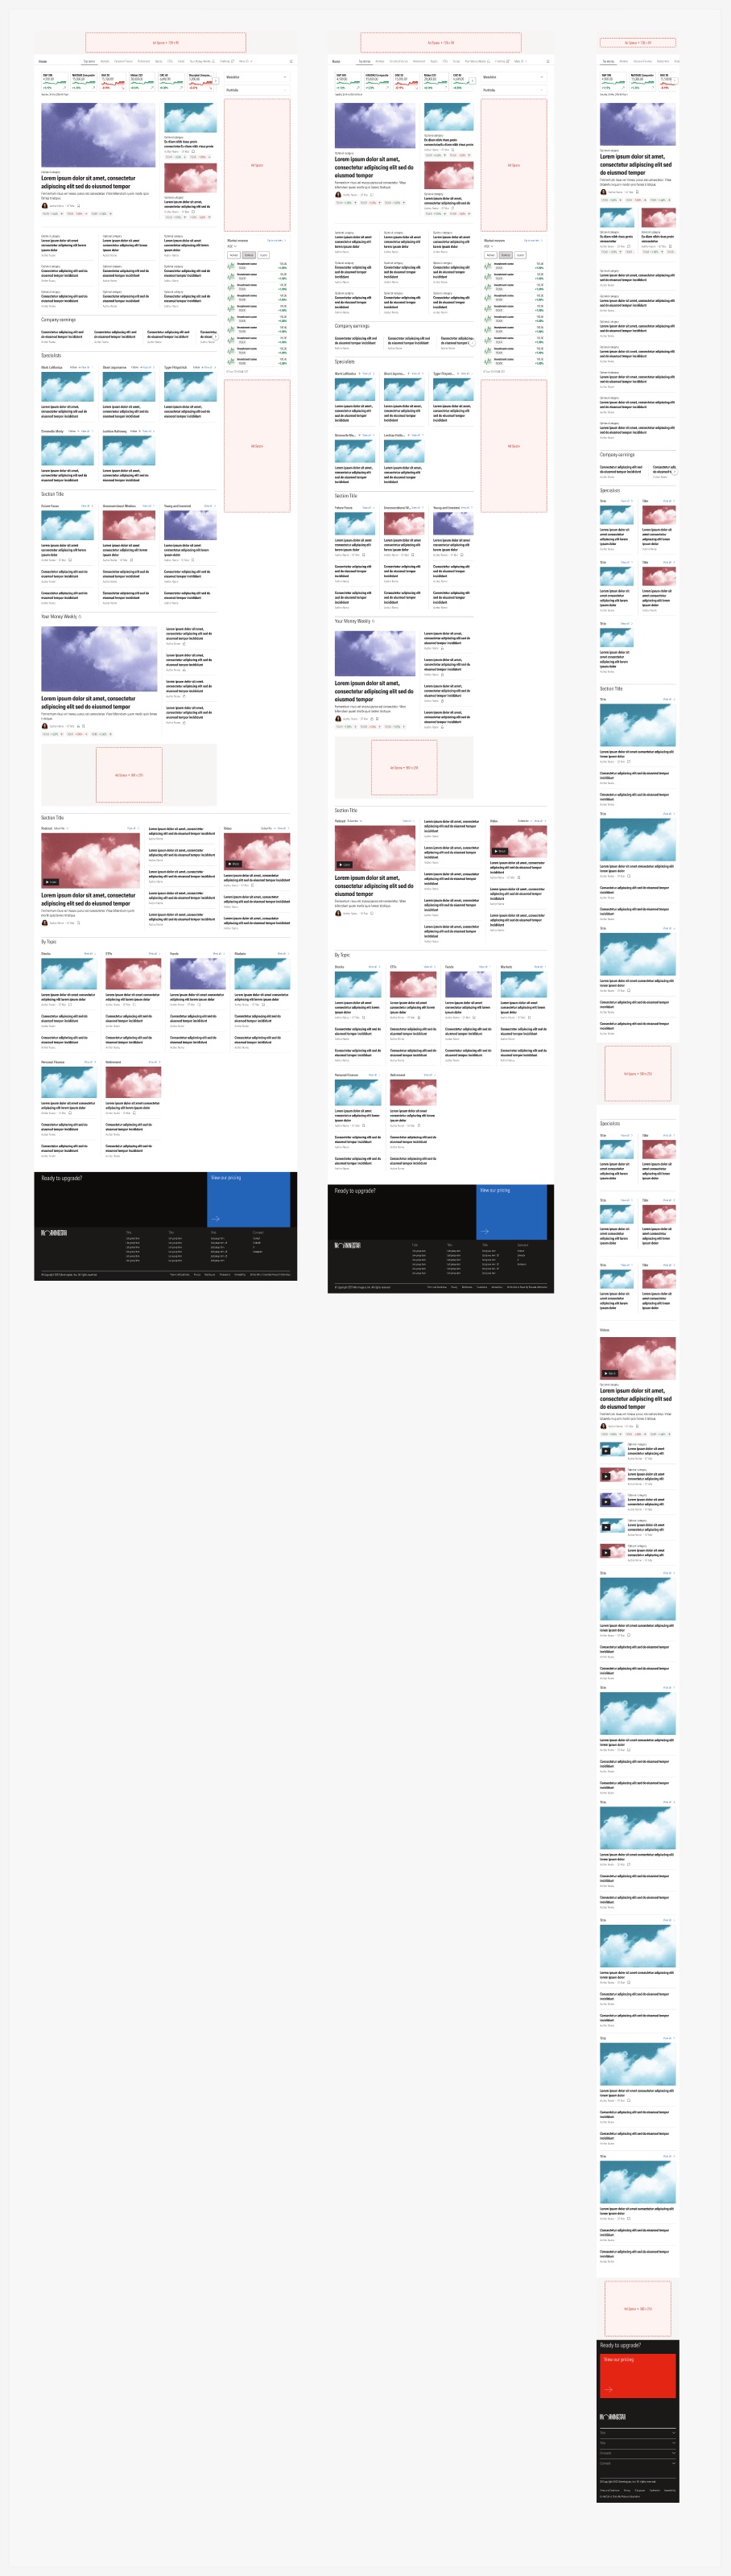
BreakpointsHome at three sizes
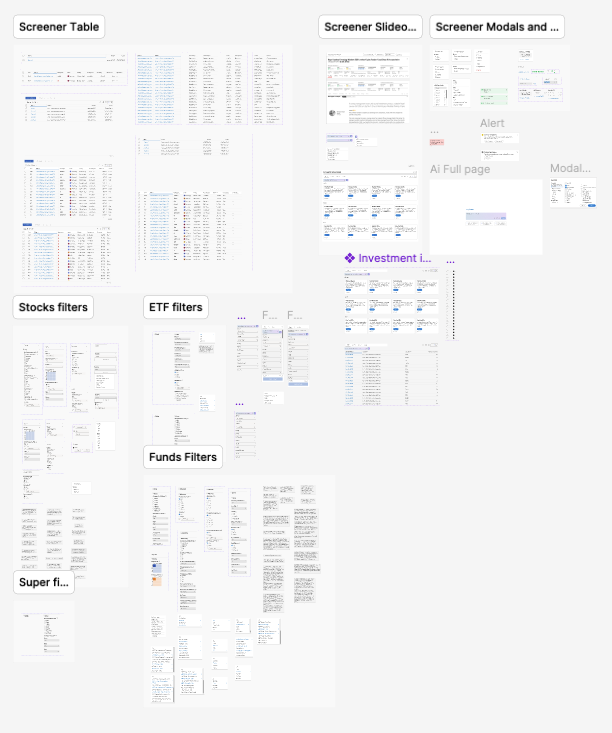
Screener partsTables, filters, slide-outs and modals
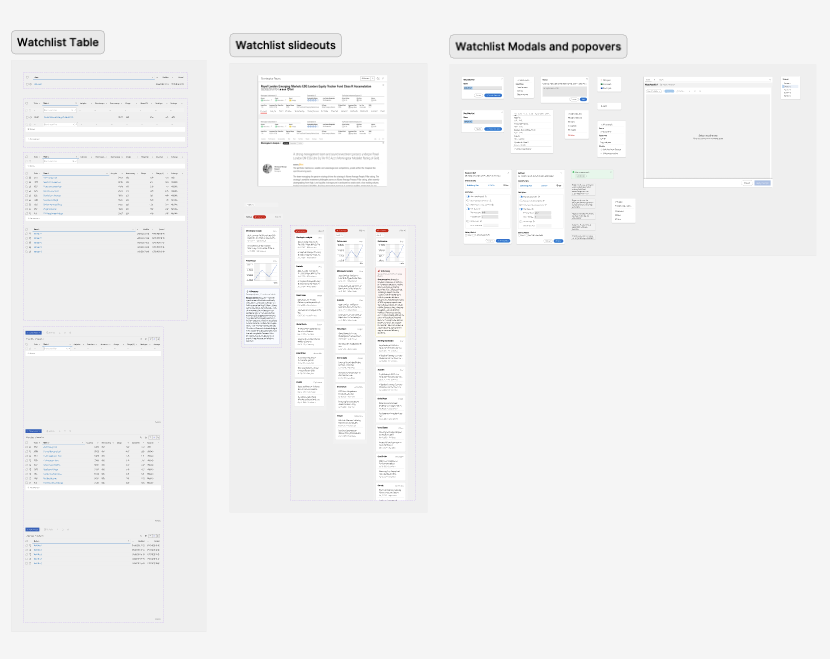
Watchlist partsTables, slide-outs and popovers
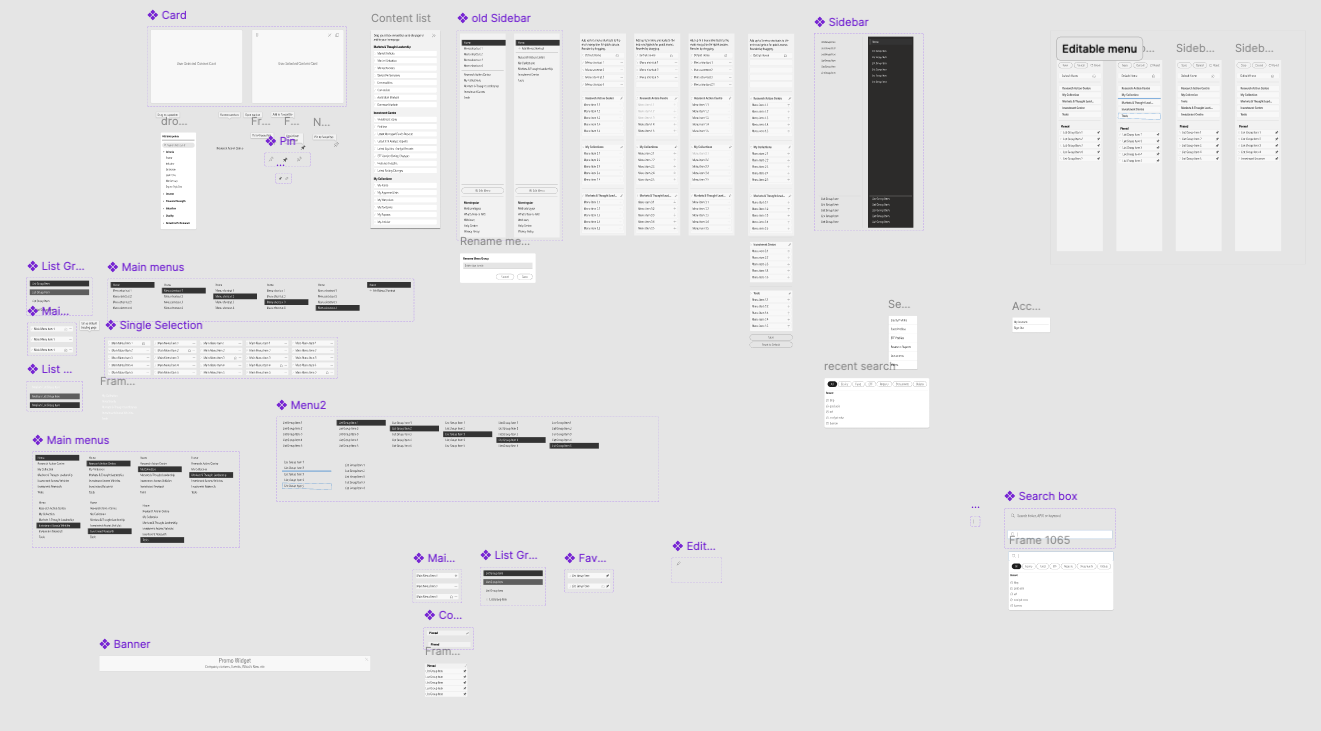
Navigation partsSidebars, menus and search
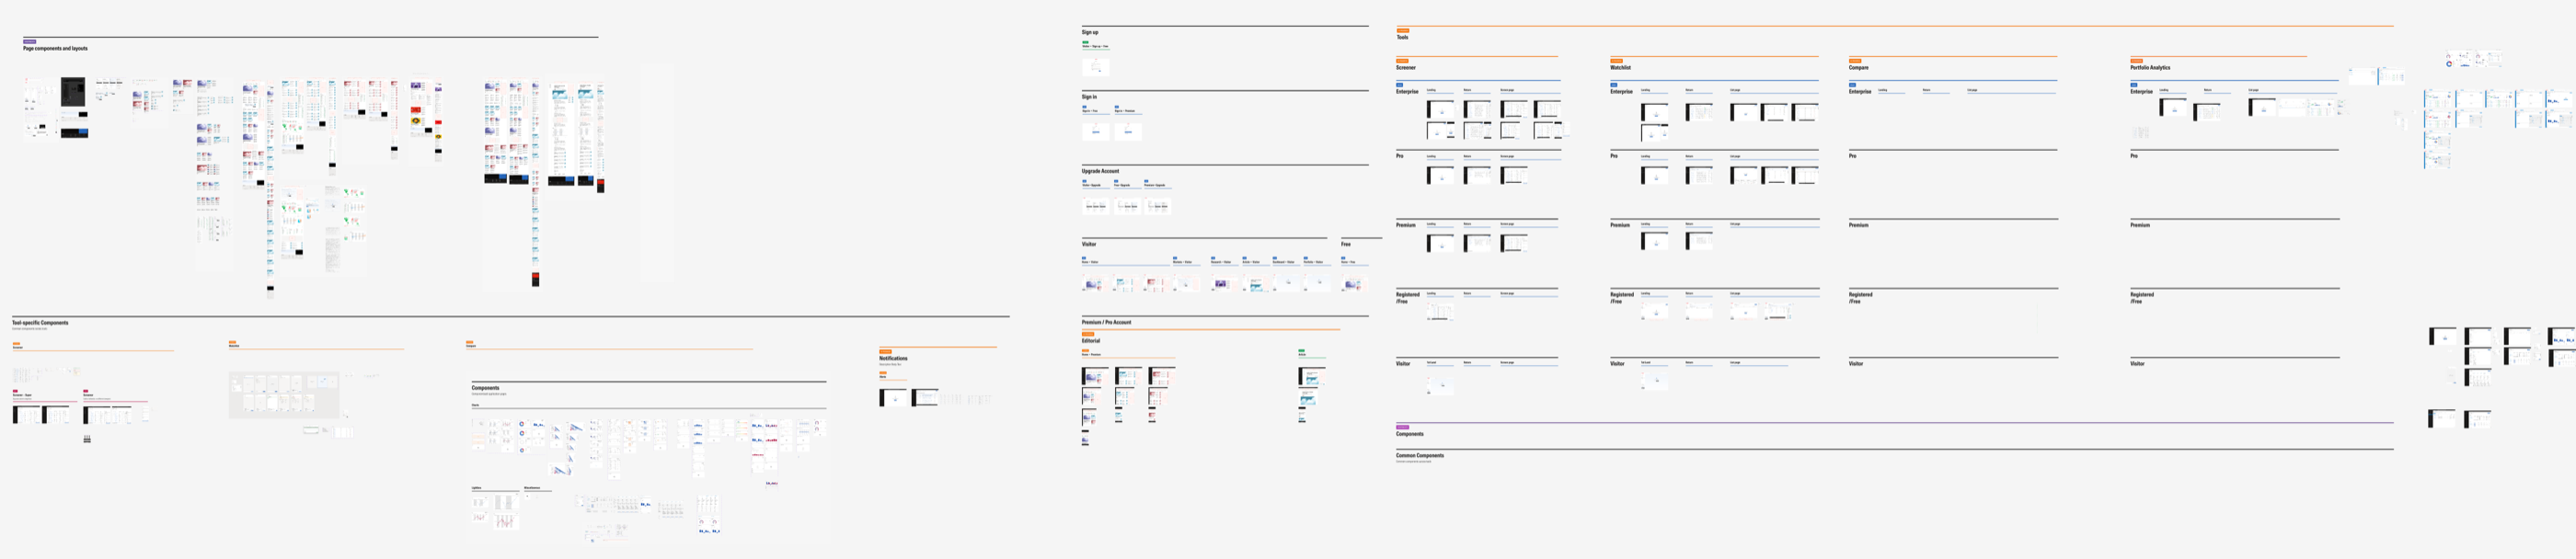
The Figma design file
Everything above lives in one Figma file, laid out as a grid: tools in columns, membership levels in rows, and the account, editorial and component sections around them. Anyone on the team can find a screen by asking two questions: which tool, and which level.
09 · Outcome
Where it stands
By July 2026 four modules had been built and released: the Screener, the Watchlist, Compare and the article page. Two measures moved while I was there: the System Usability Scale score rose from 59 to 88, and the Net Promoter Score from 29 to 67. I left Morningstar that month, before the growth, retention and conversion results were in. What I can show is what the work left behind and what the team set out to measure.
What the work left behind
- One direction for the product: three platforms into one, with five levels of depth instead of separate products
- A membership model with a free level that did not exist before
- A proposed navigation, built from how users group content and tested for findability
- A shorter path from visitor to member, with clear terms at checkout
- More than 100 screens at three sizes on one component library, with the article page ready for development
What the team set out to measure
Operational complexity first: fewer duplicate features and systems. Then user outcomes: engagement across research journeys, retention and renewals, conversion to paid plans, and less drop-off in key workflows. Each level also carried its own primary measure, from conversion to a free account at the top of the funnel to retention at the Pro level.
What I learned
Get the research in before the screens, not after. The navigation test arrived near the end and showed that people were confident and wrong about our labels. Had it run three months earlier, the first round of screens would have carried better words, and the team would have argued less about structure.
Five advisers is a sample, not an answer. We treated their results as directional, which was right, but it left the biggest open question of the project, whether navigation should change by role, unresolved when I left. Next time I would recruit the harder audience first and accept a slower start.
The premortem was the most useful hour of the project. The team named the fear that the levels would feel the same before a single screen existed, and that fear shaped the gating patterns, the wording per level and the plans page. I would run one on every project, and earlier.