
Background
Morningstar is the number one independent investment research company in Australia. It had two paid research products. Morningstar Investor is for people who do their own research and track their own portfolio. Adviser Research Centre, or ARC, is for financial advisers, who use it to search and compare investments, keep watchlists and build model portfolios.
Growth in both products was in single digits, 6% for ARC and 8% for Morningstar Investor, and trending down. The business wanted double-digit growth, members who stay, and free users who convert to paid.

My role
I was the product designer on a team of nine: a business owner, product, adviser and investor experts, engineering and architecture. I joined before the project formally started, because I had worked on Australian financial planning products before.
I ran the team's workshops, audited our sites, compared us with the market and mapped the membership flows. I designed the journeys and screens, and I ran the research: a card sort, a navigation test and the usability sessions on the new Screener.
 Framing workshop
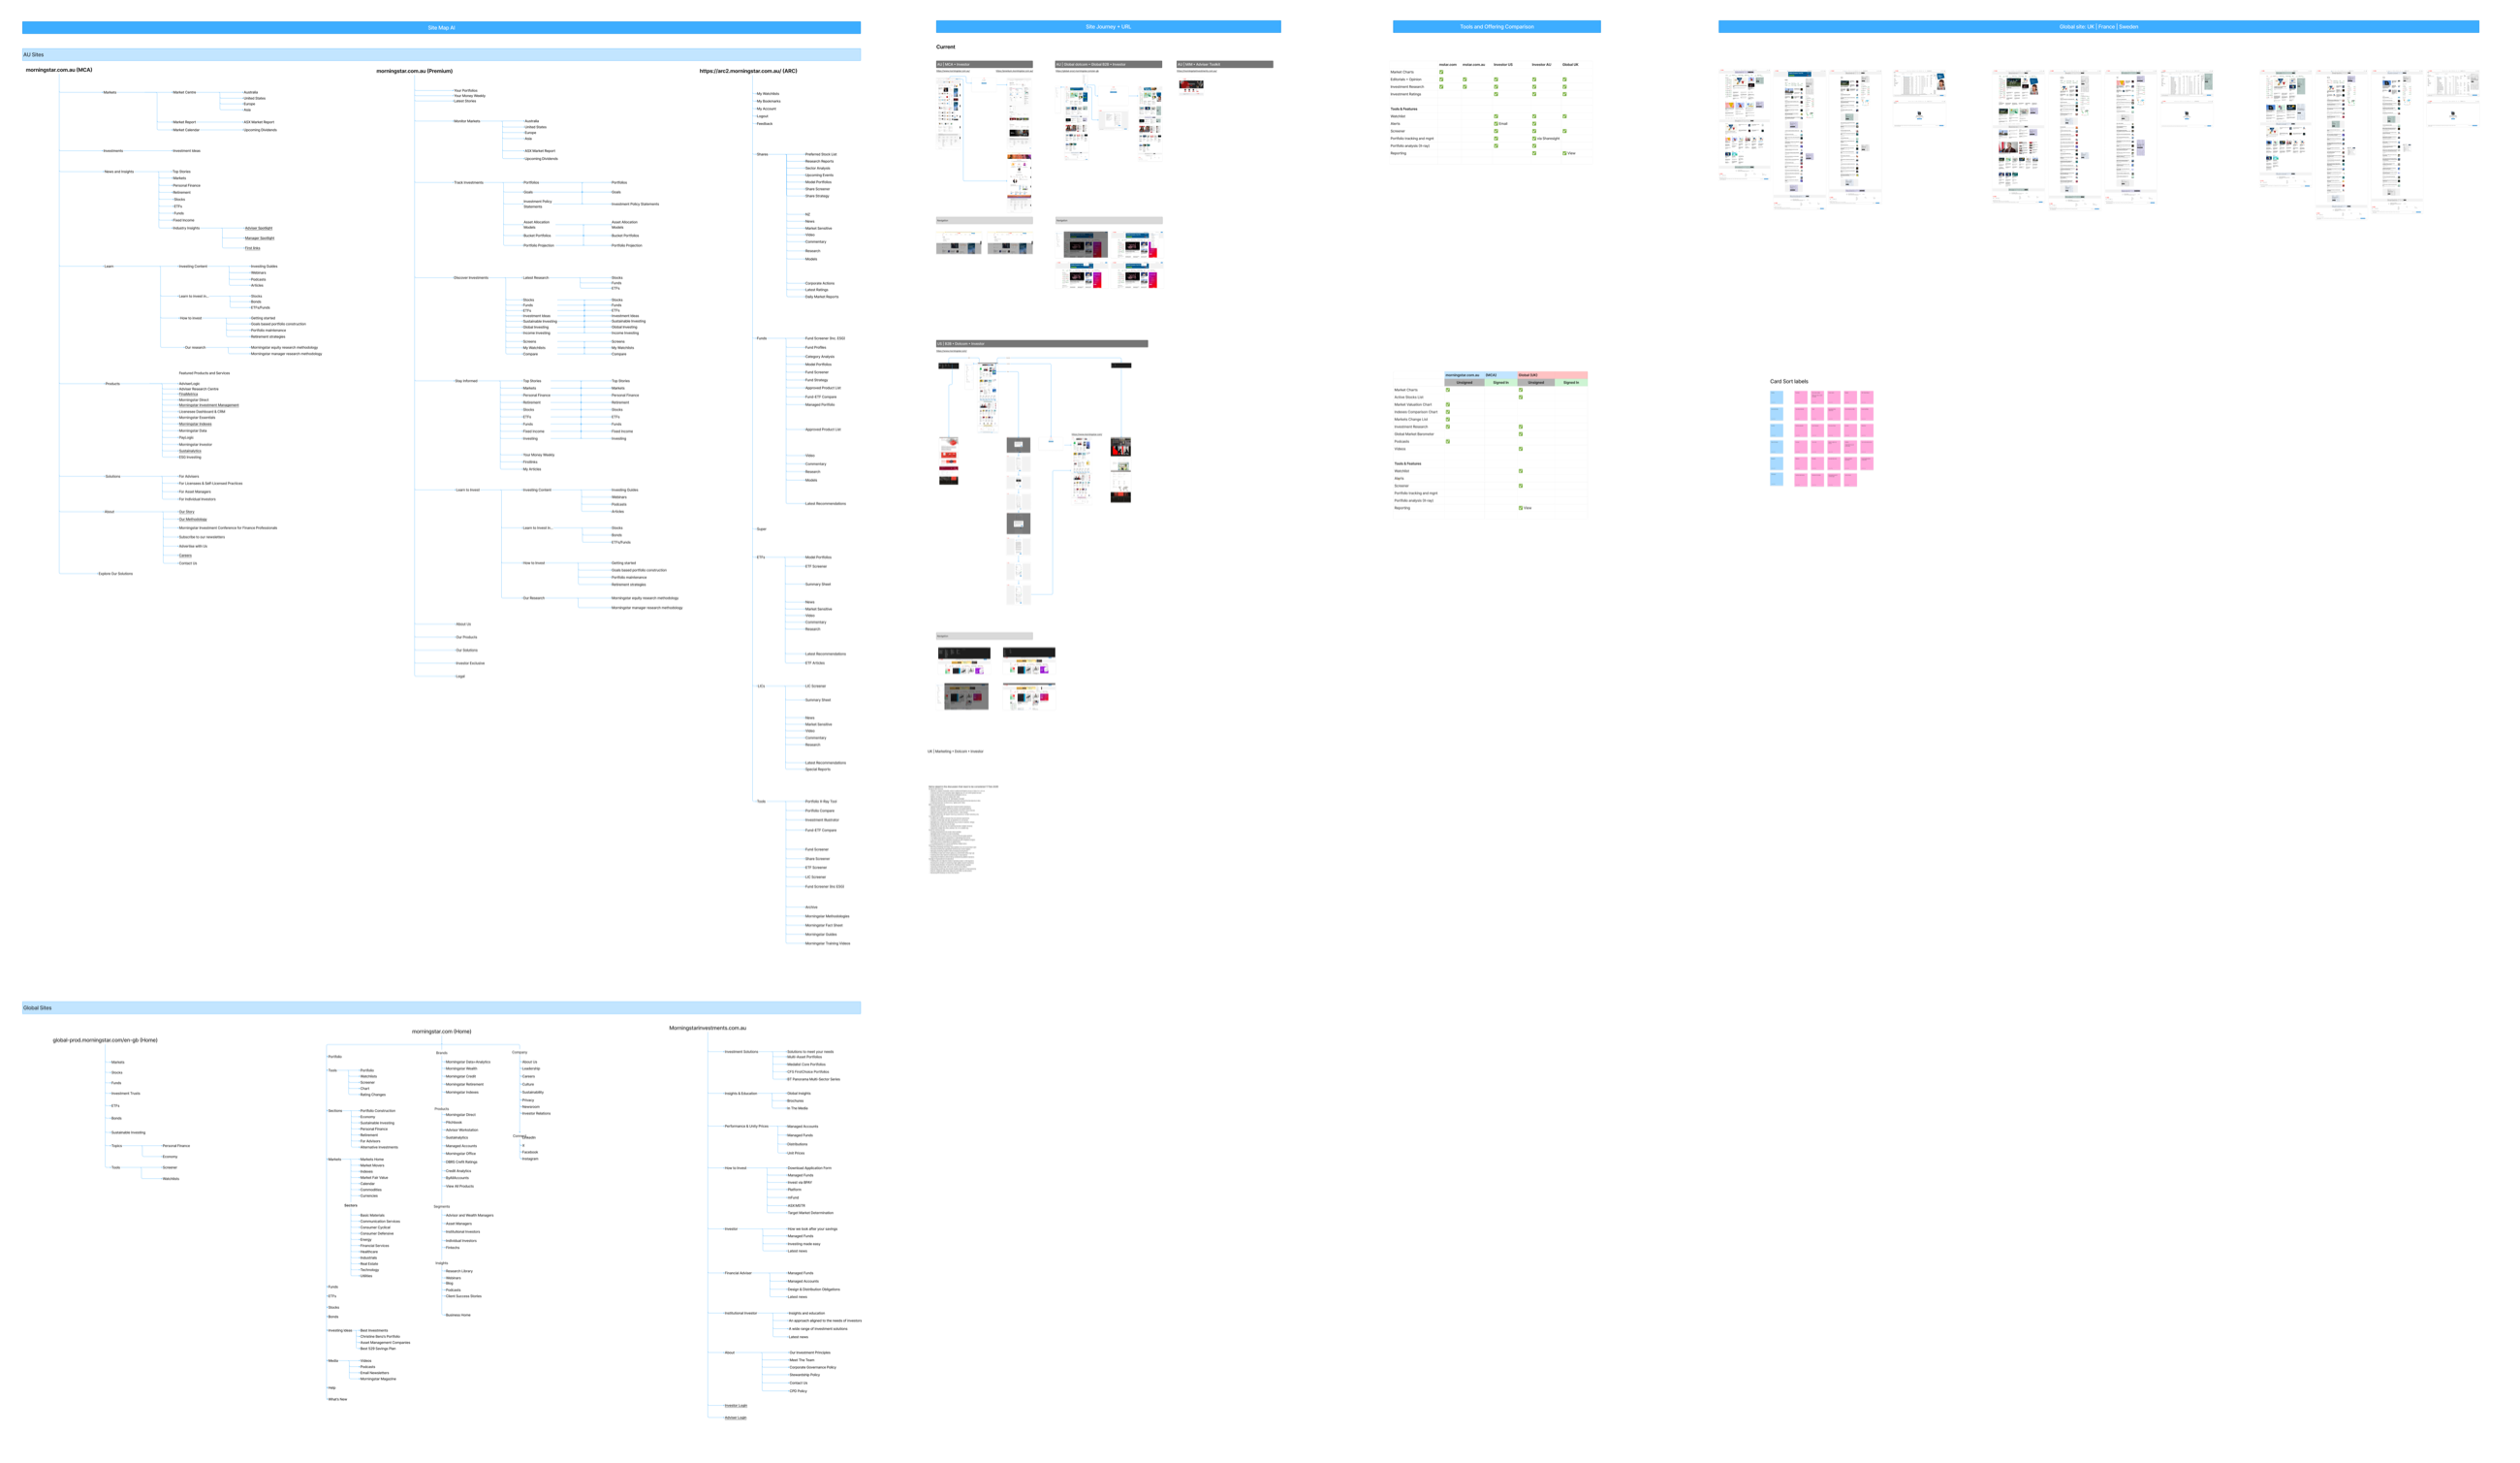 Audit of six sites
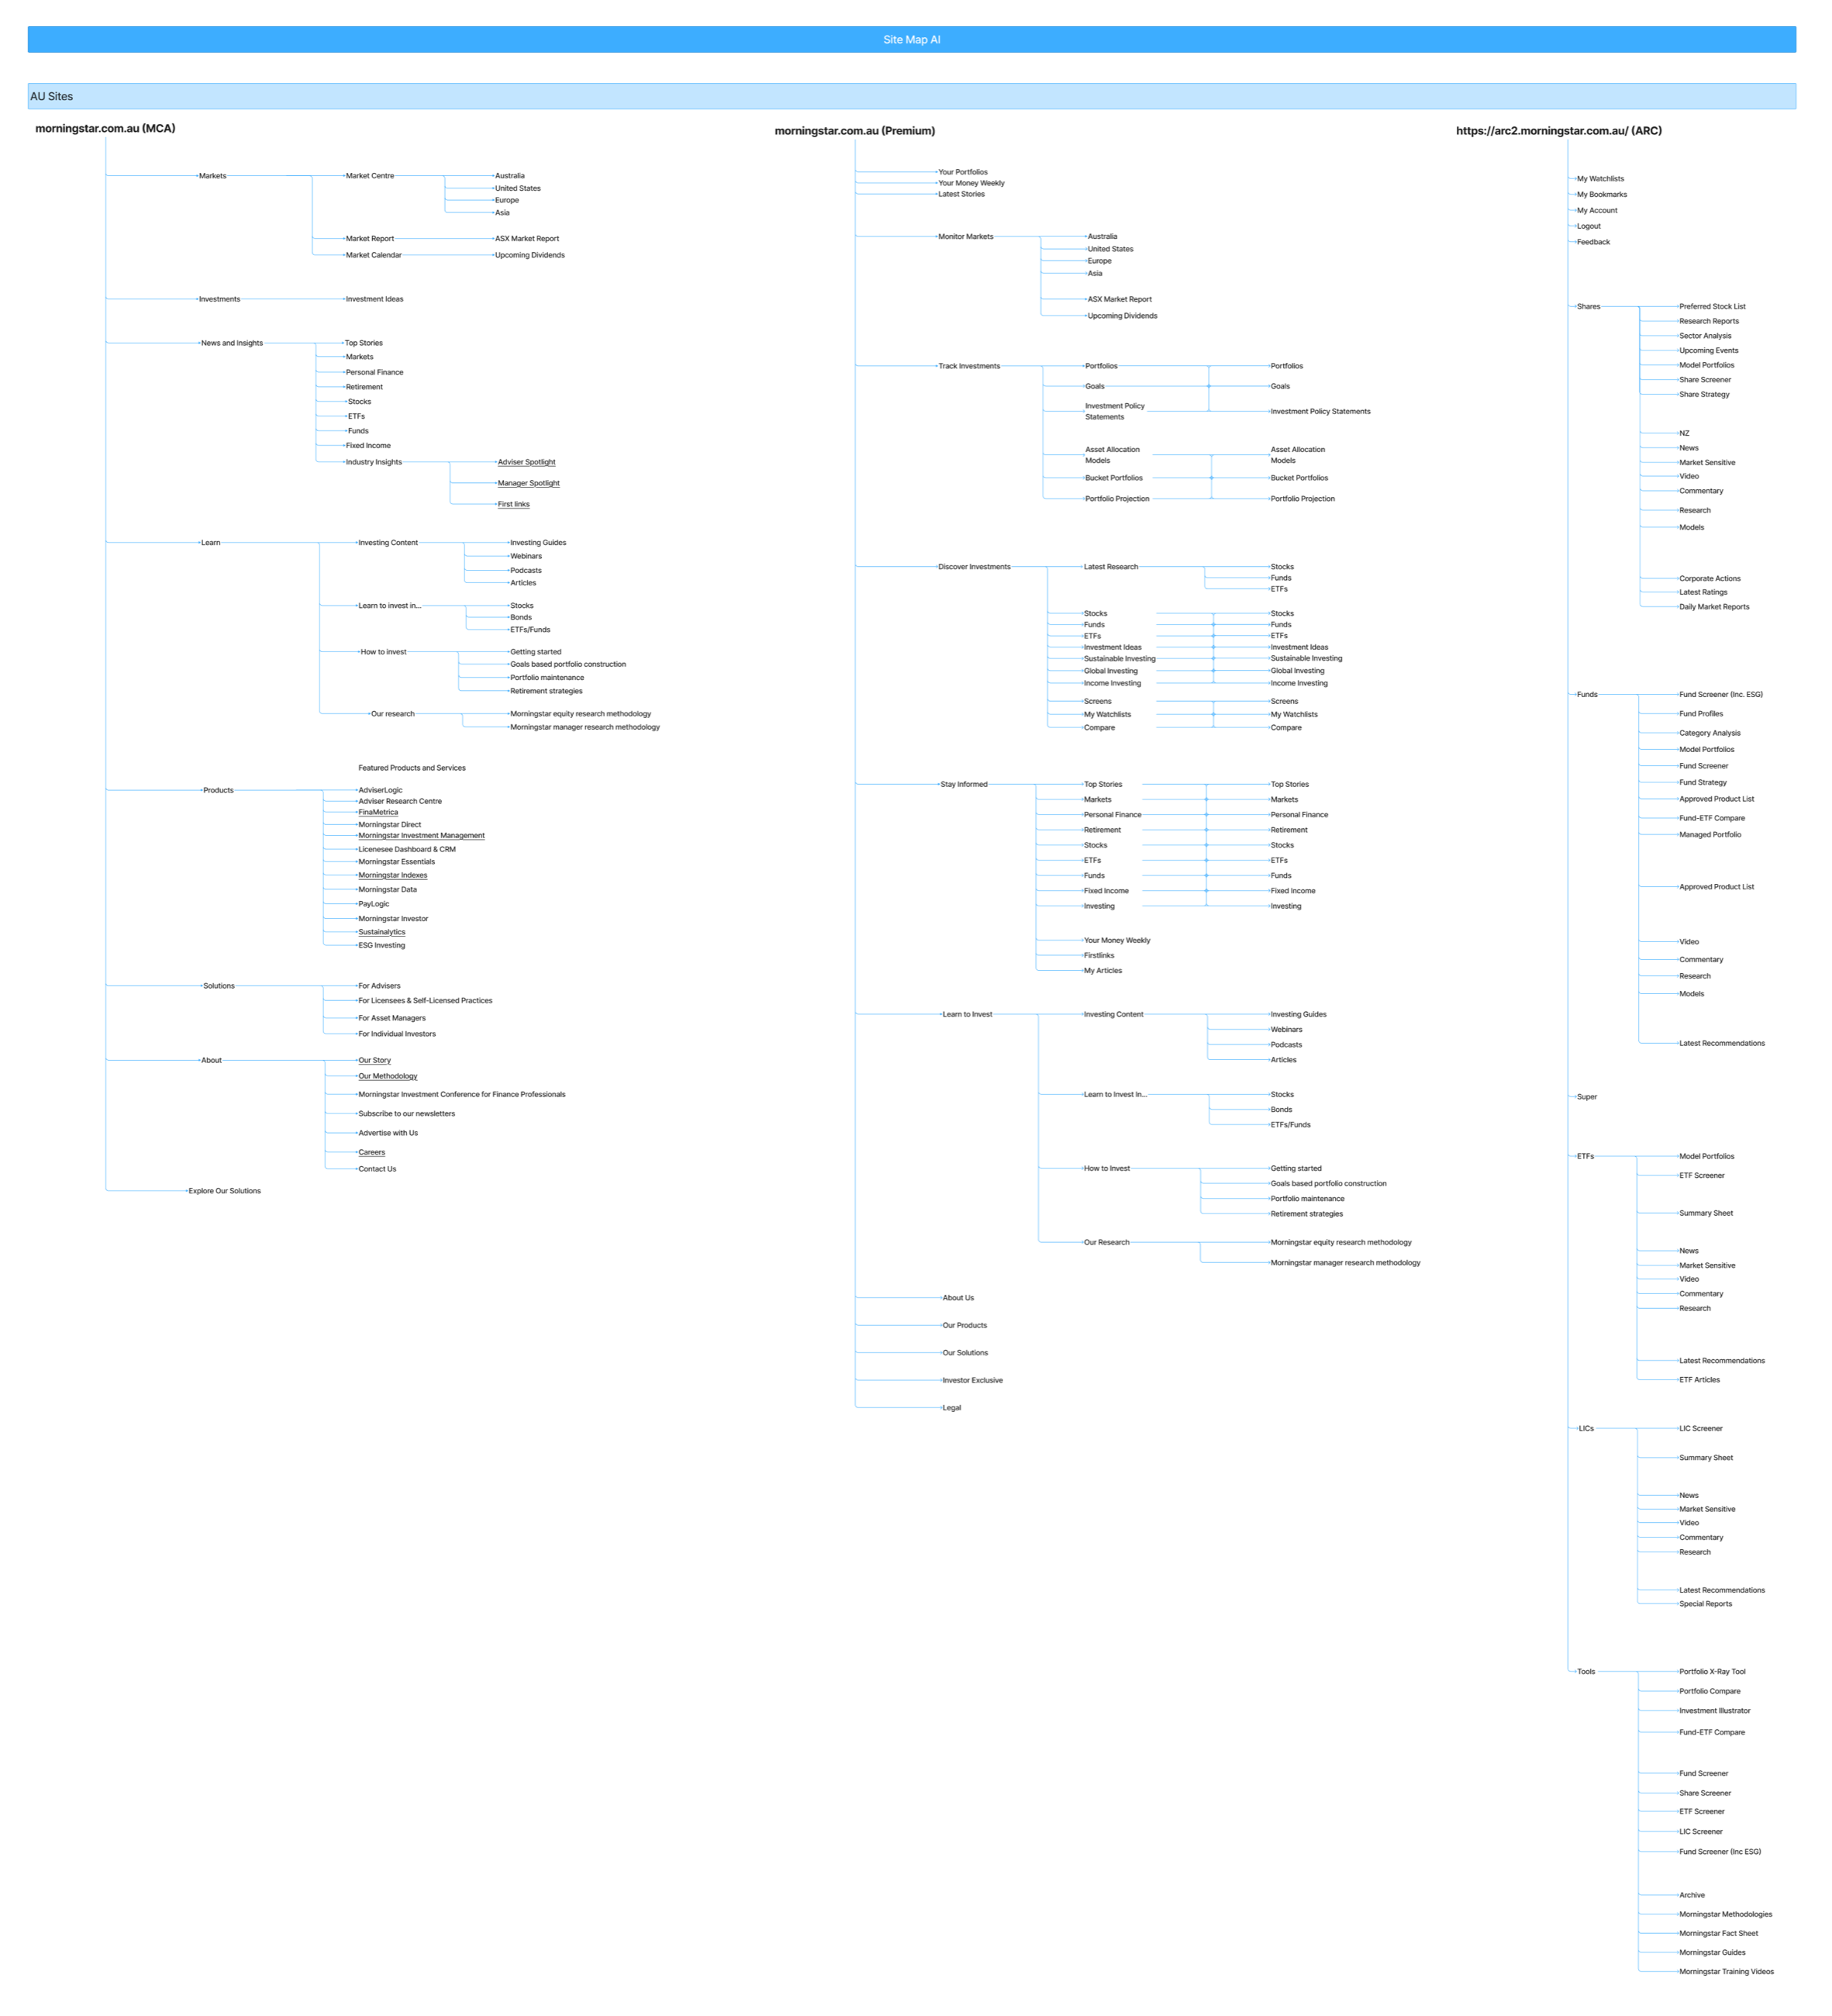 Site maps
 31 products compared
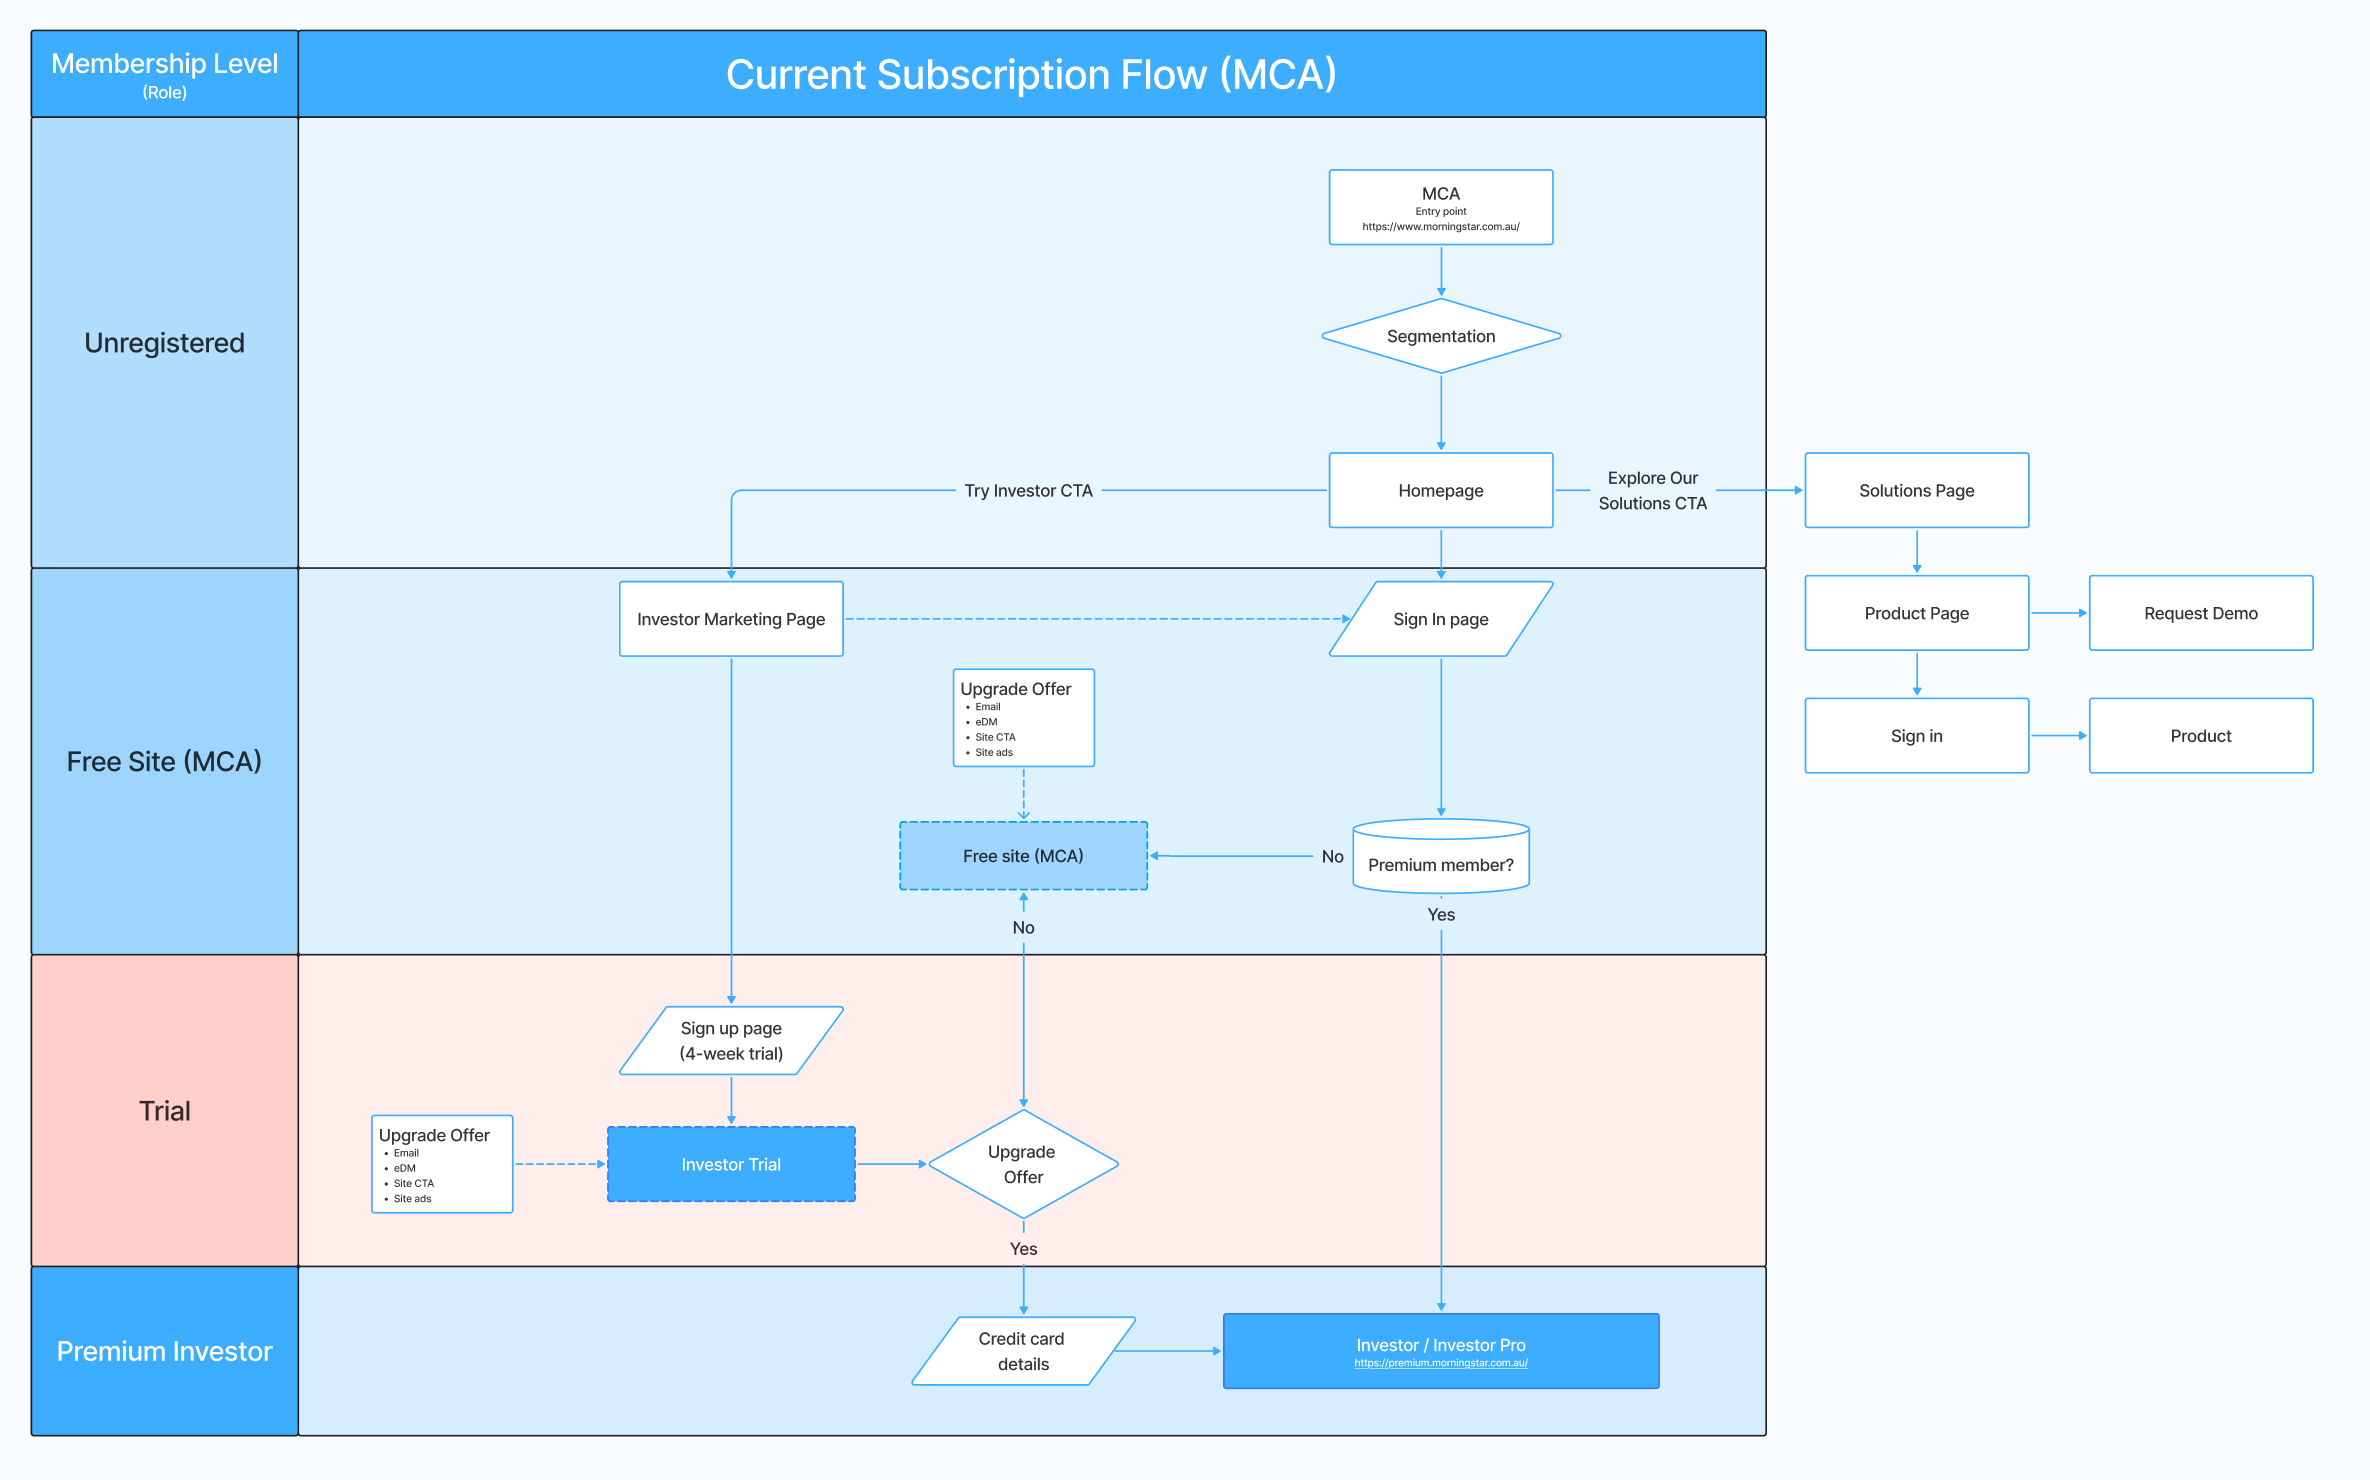 Current flow, Australia
 Current flow, with screens
 Current flow, global
 Personas and packaging
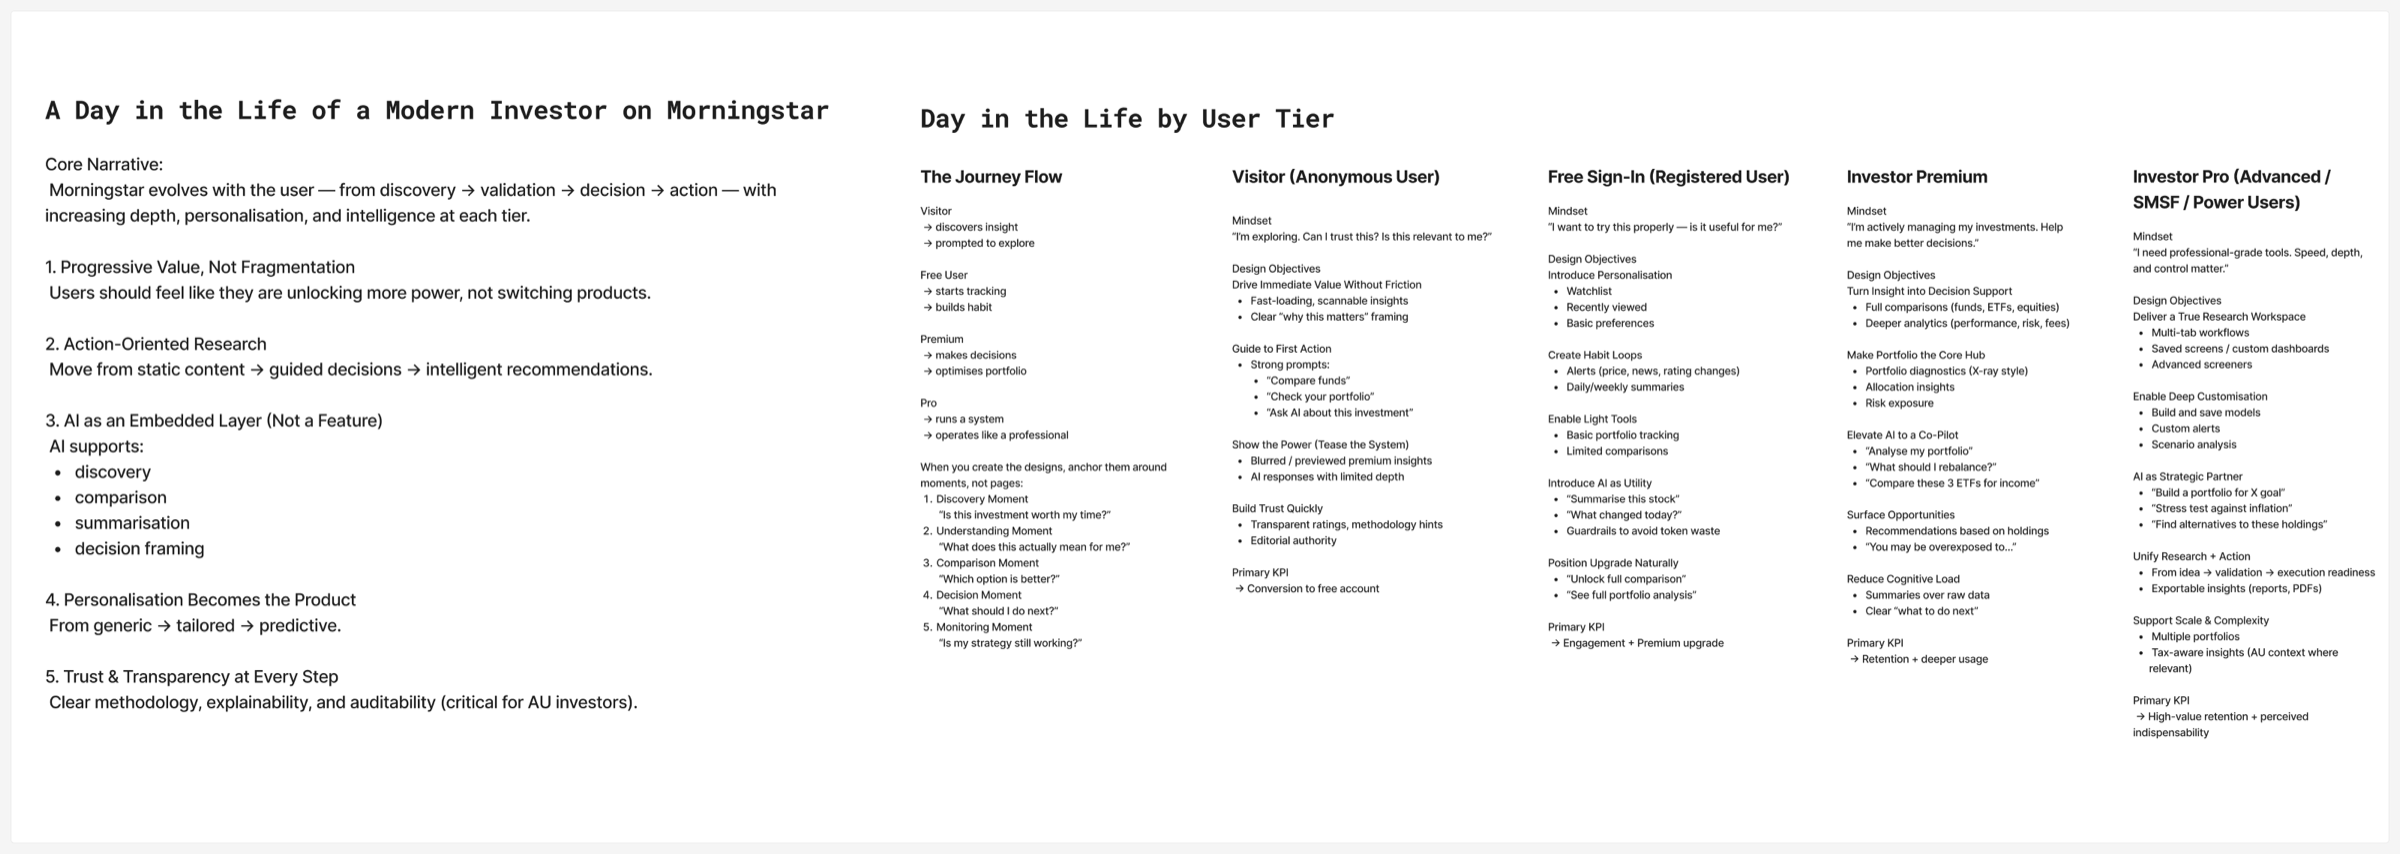 Day in the life
 Sailboat
 Premortem
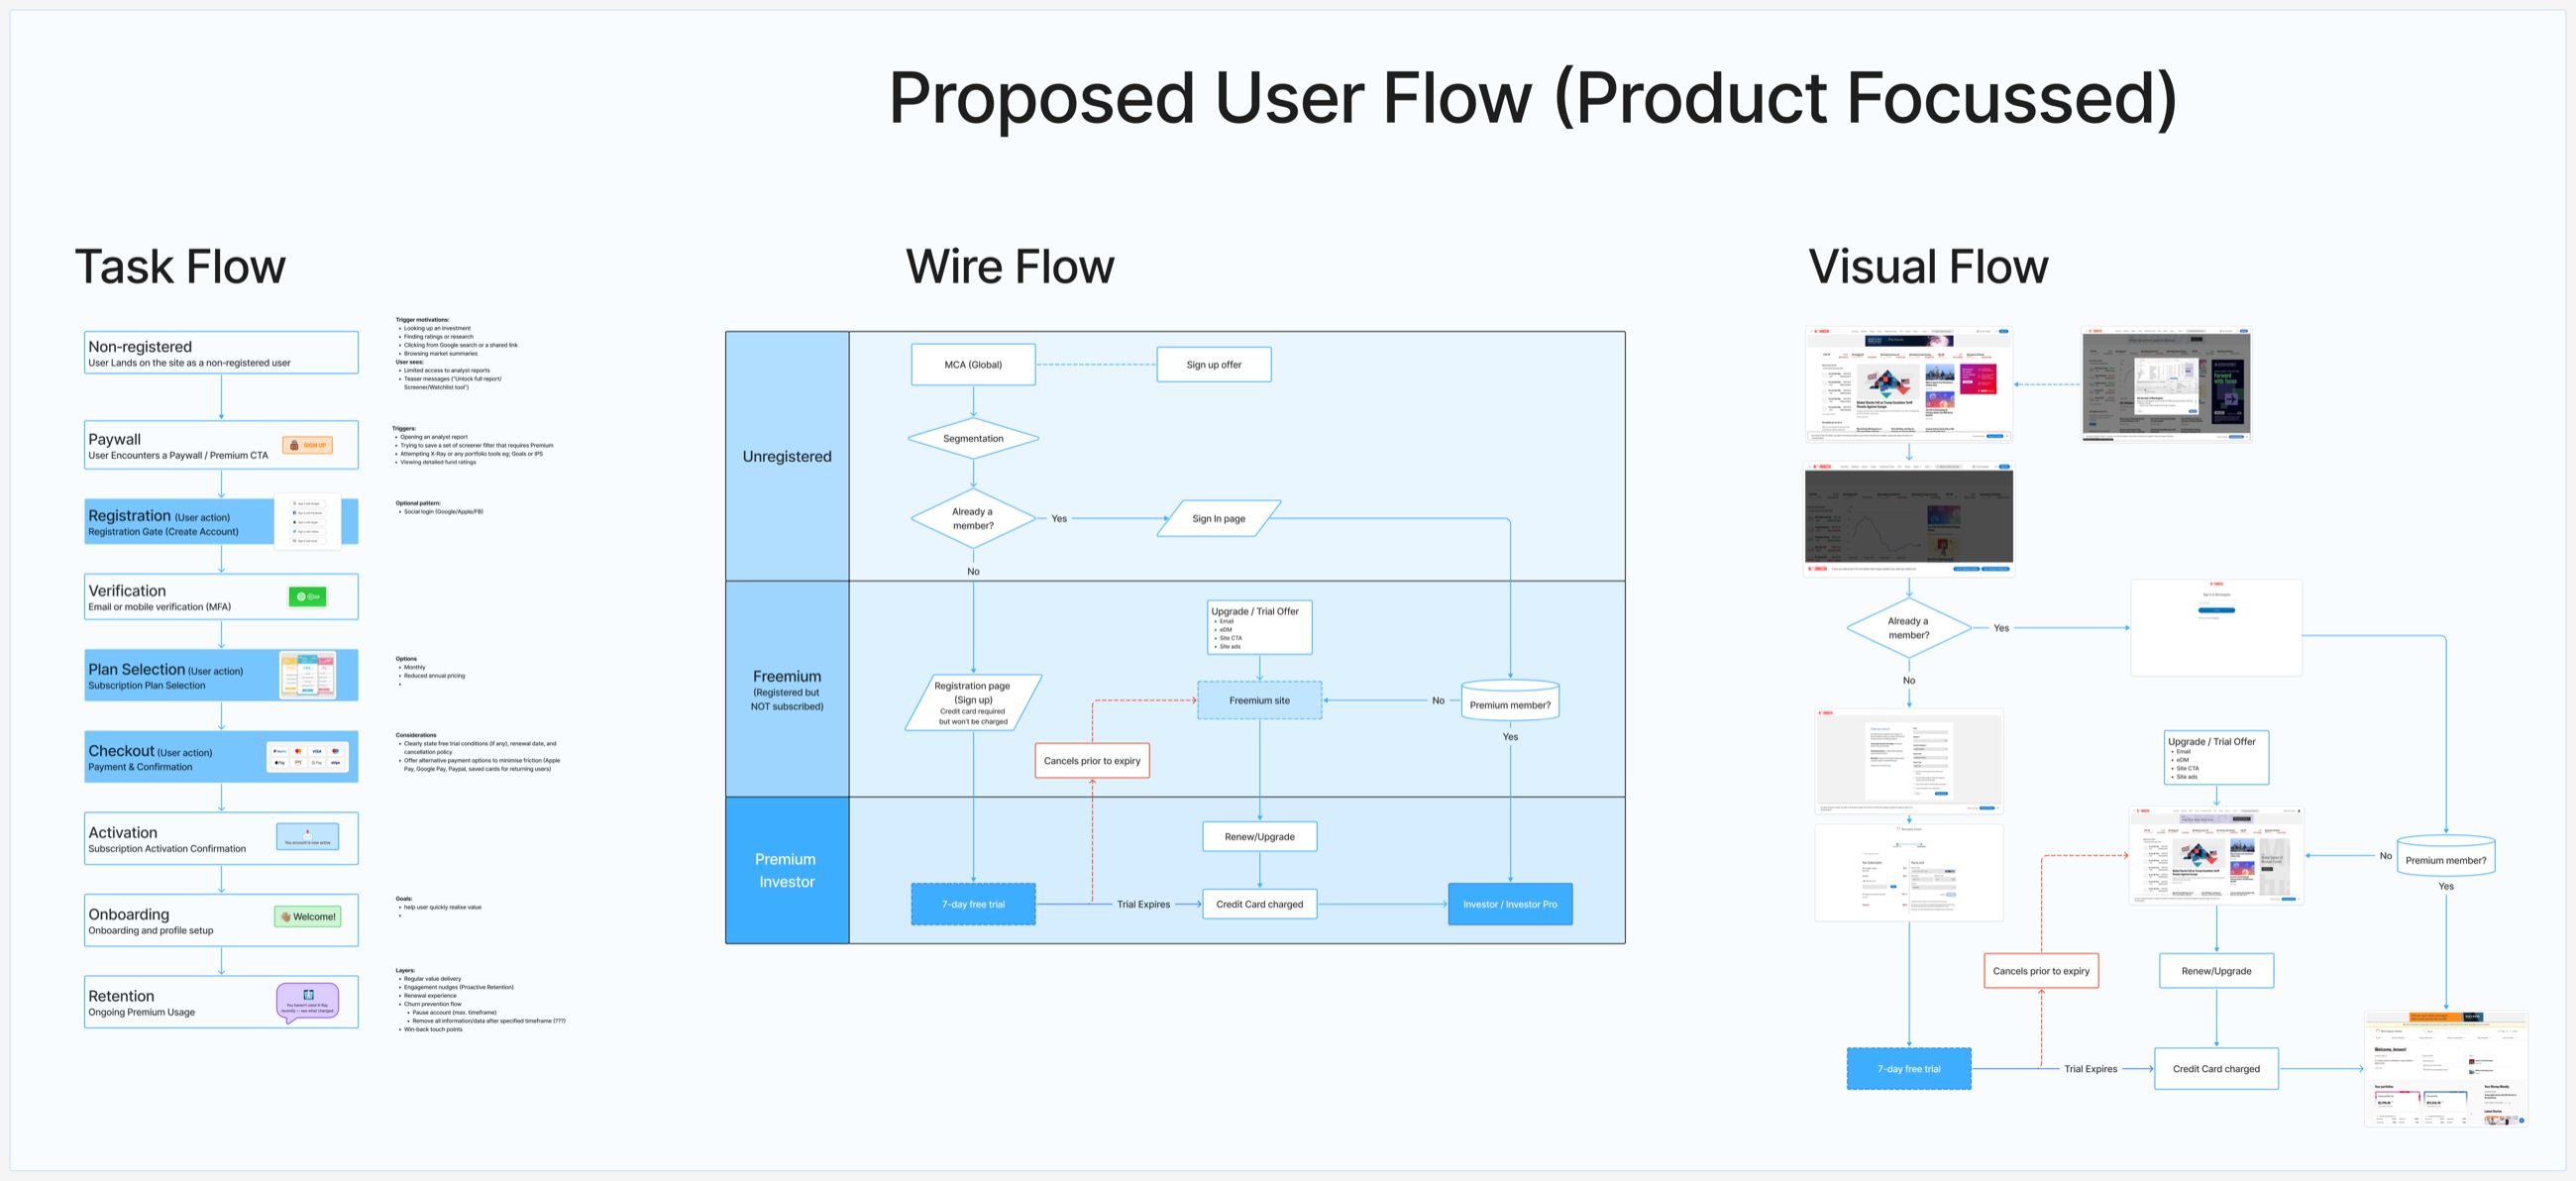 Proposed flow
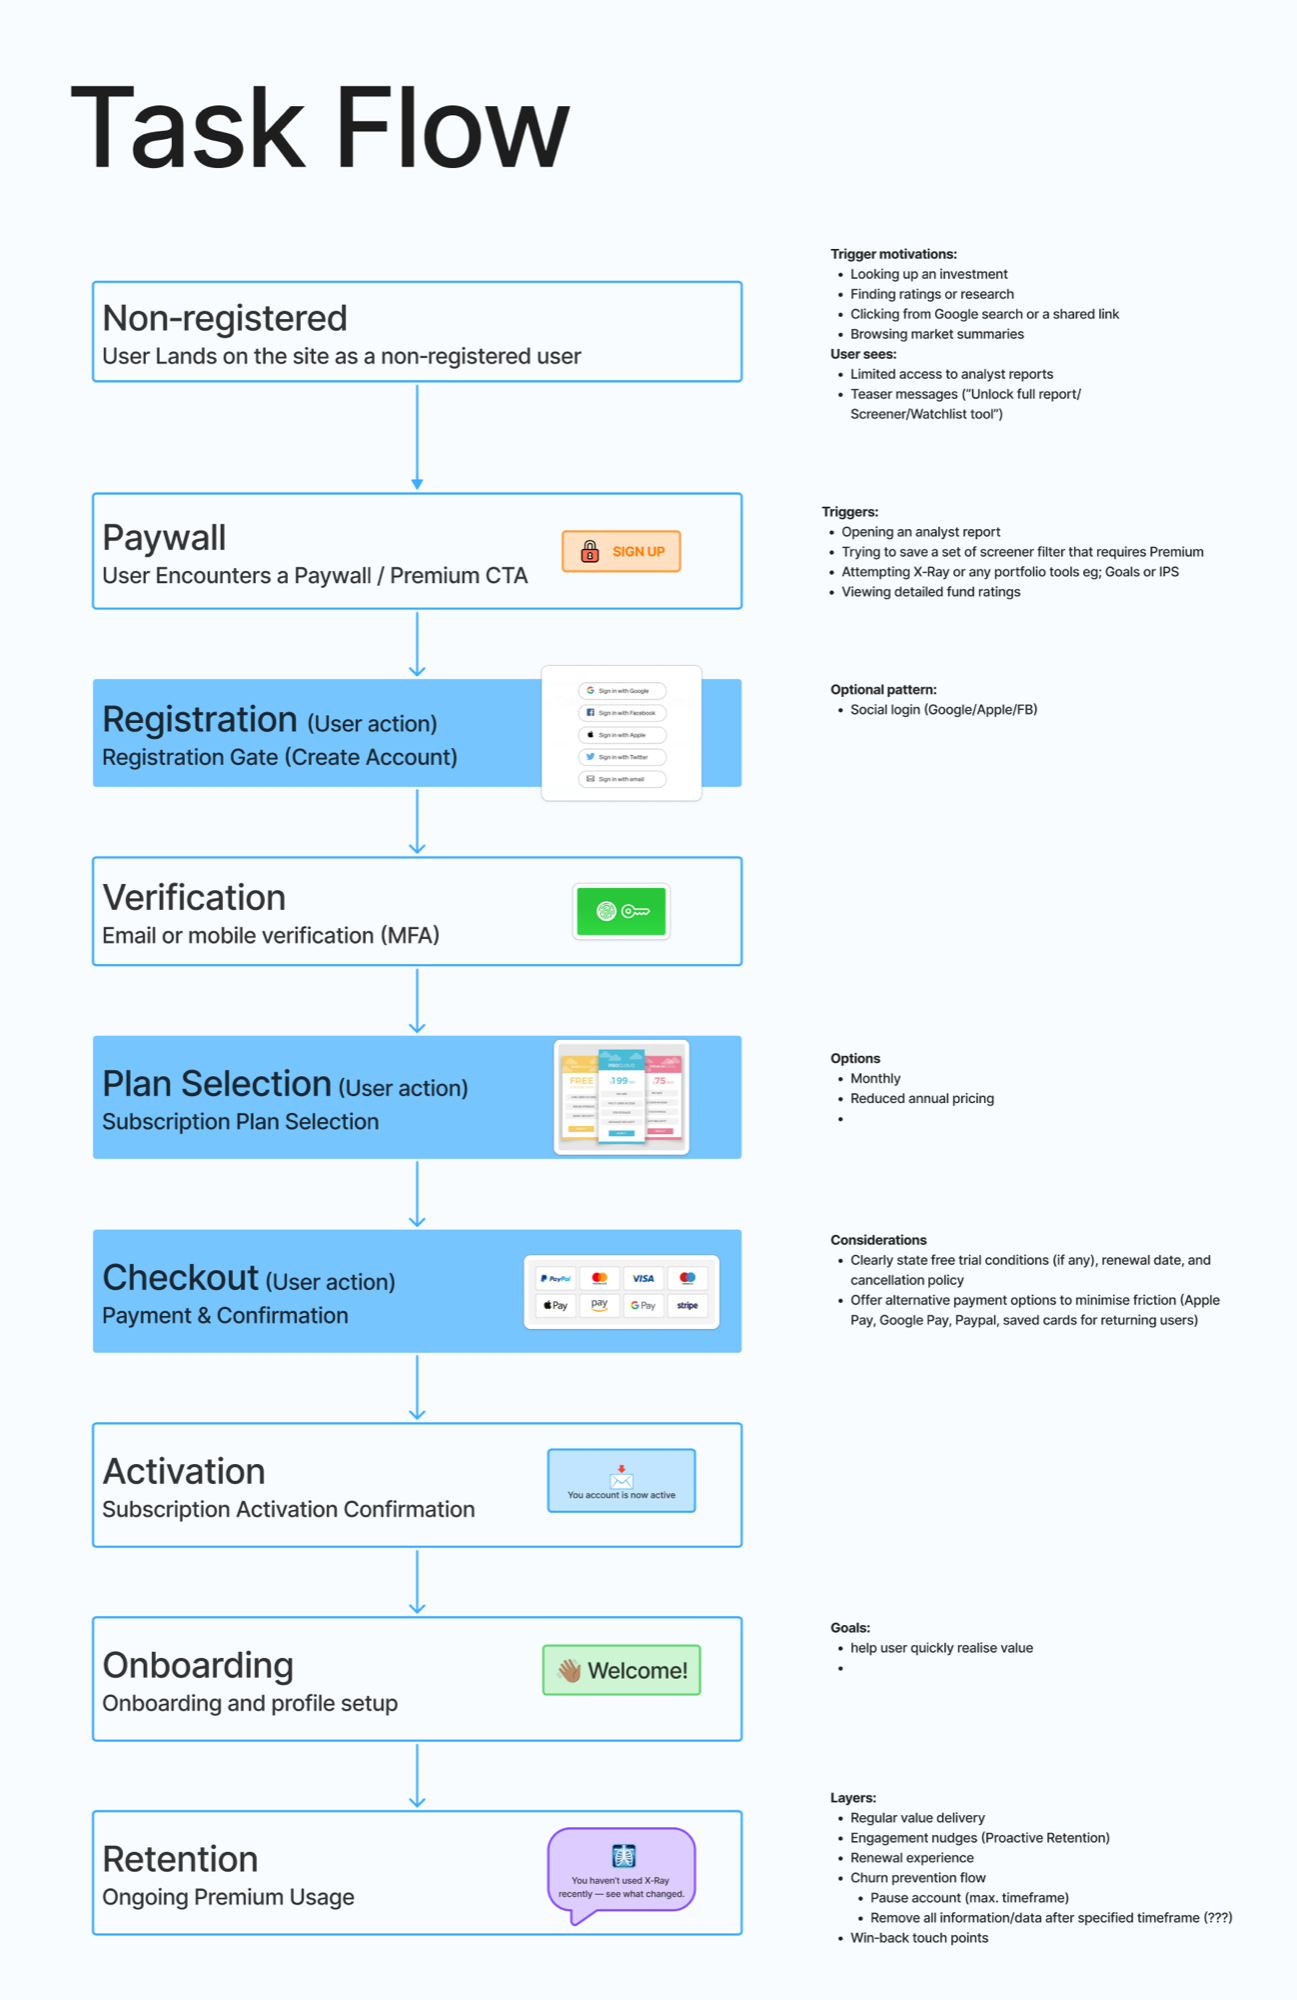 Task flow
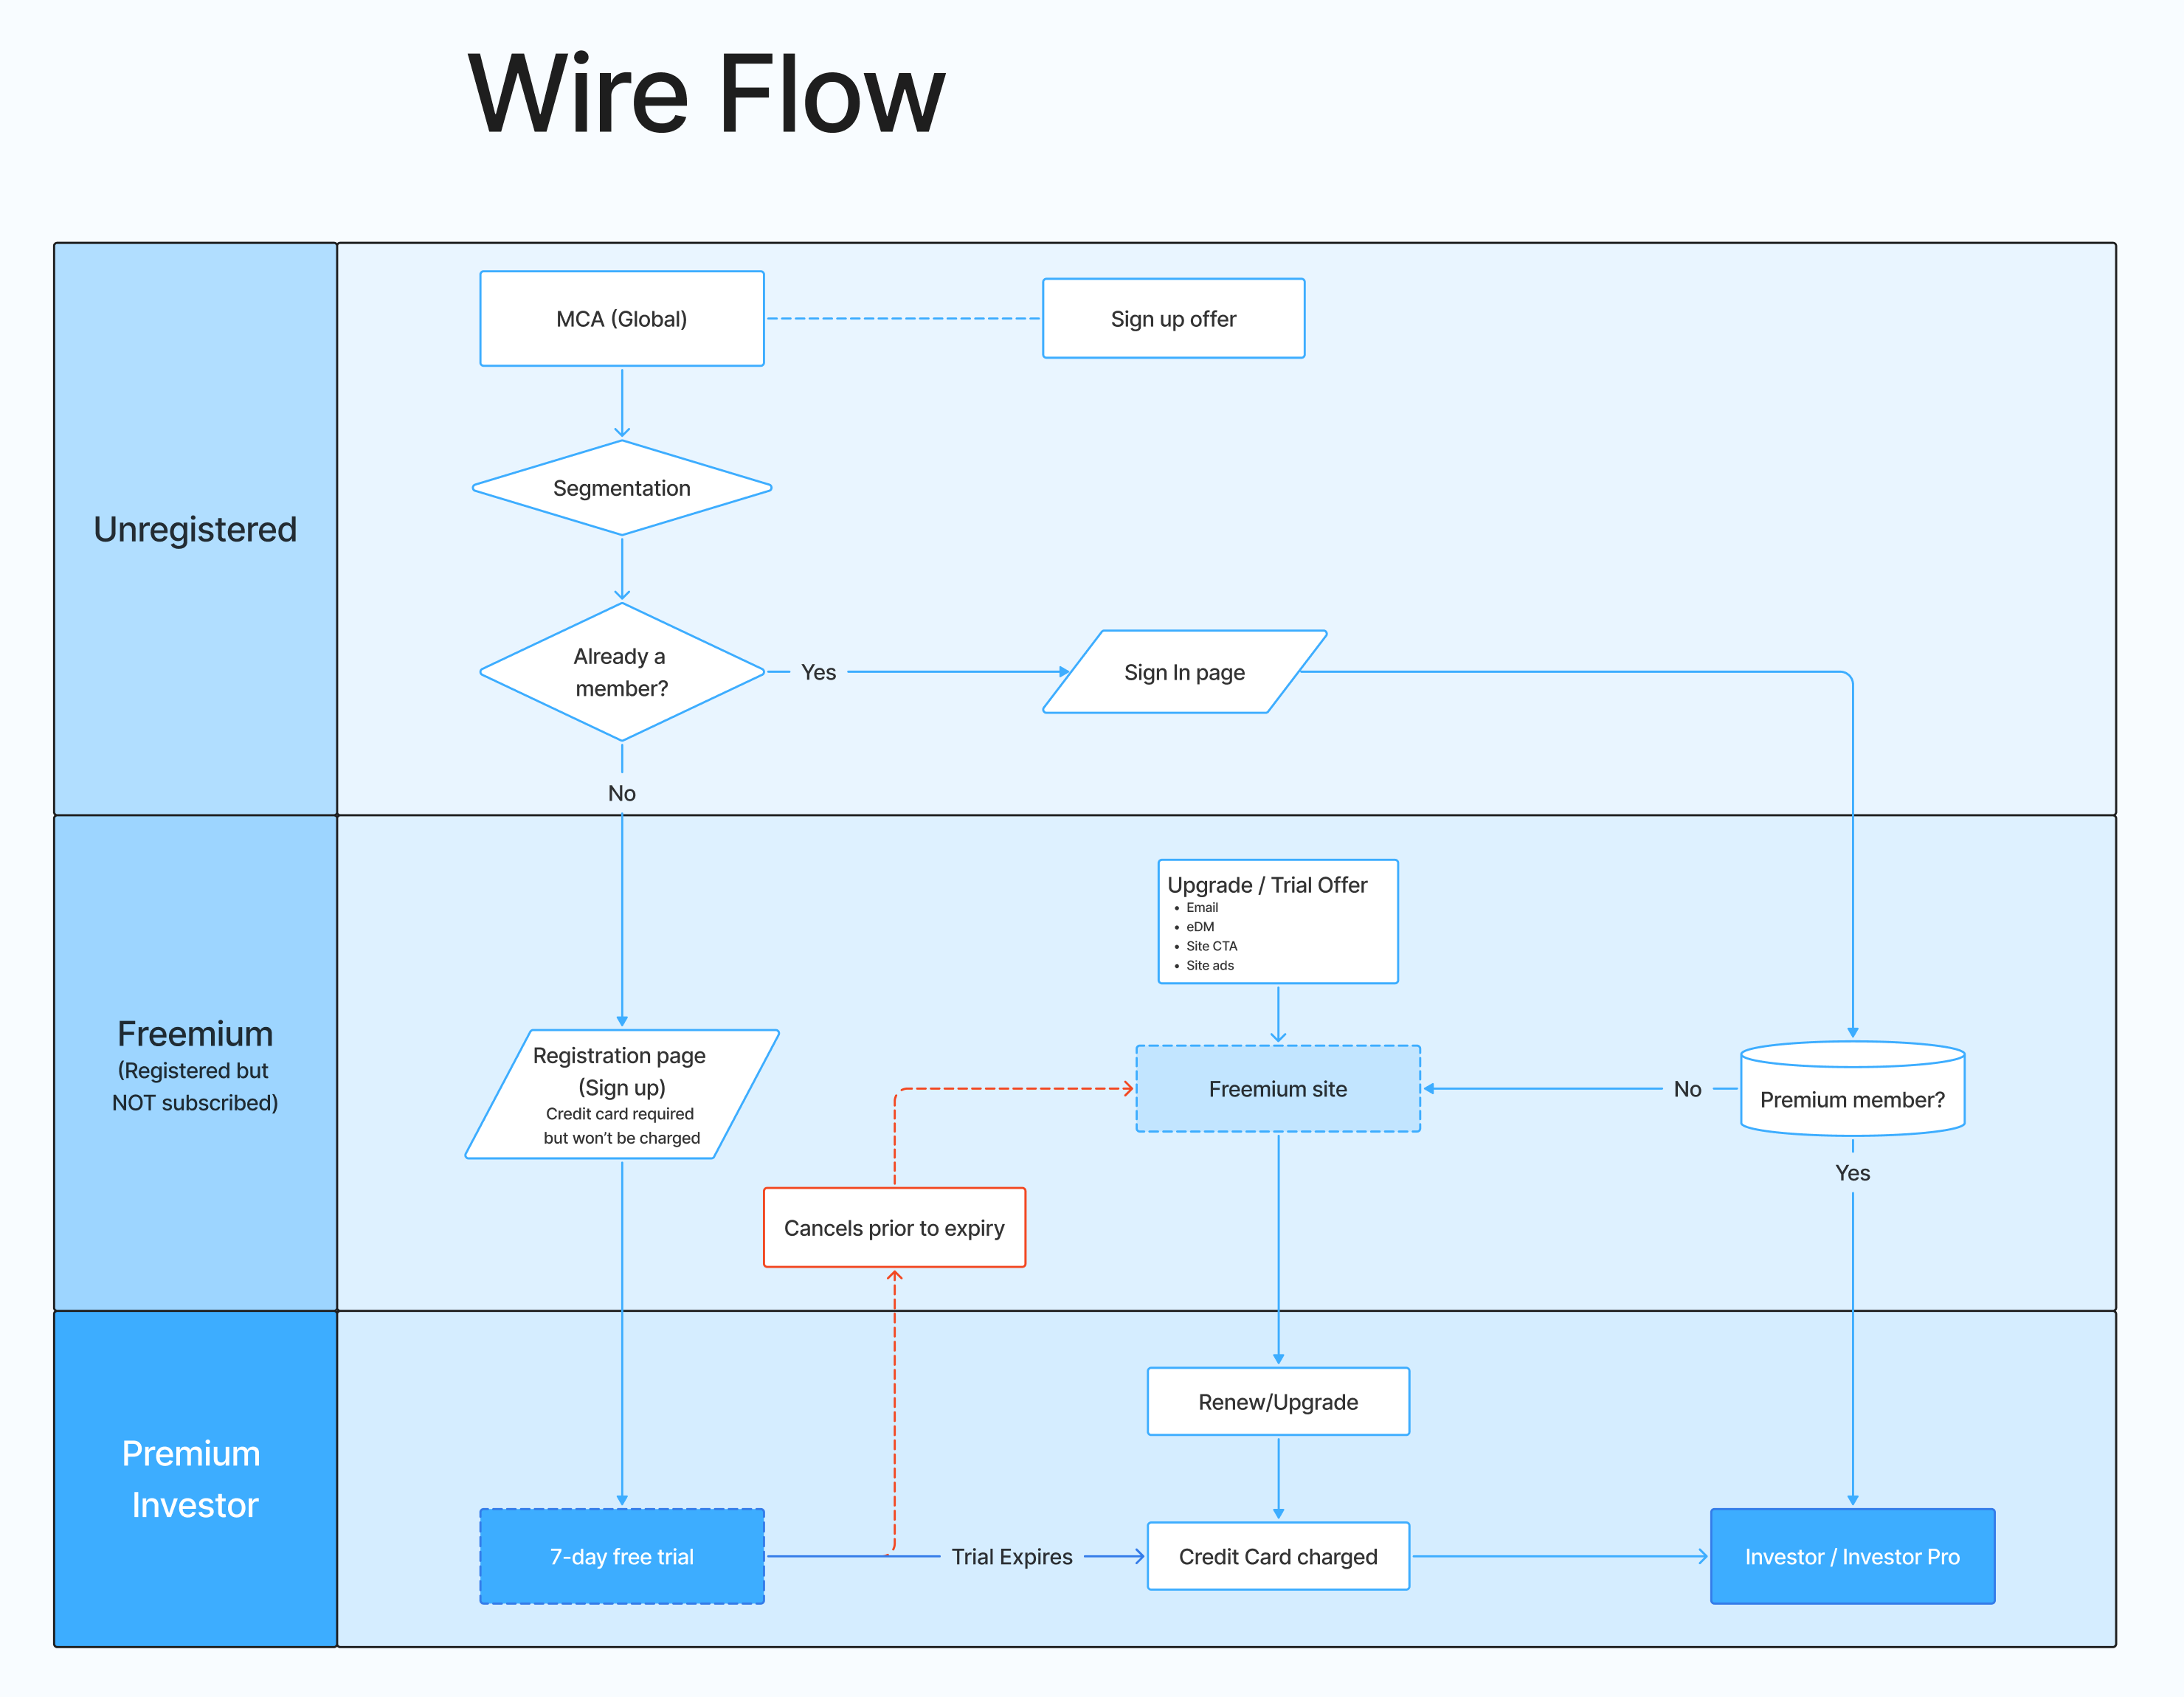 Wire flow
 Visual flow
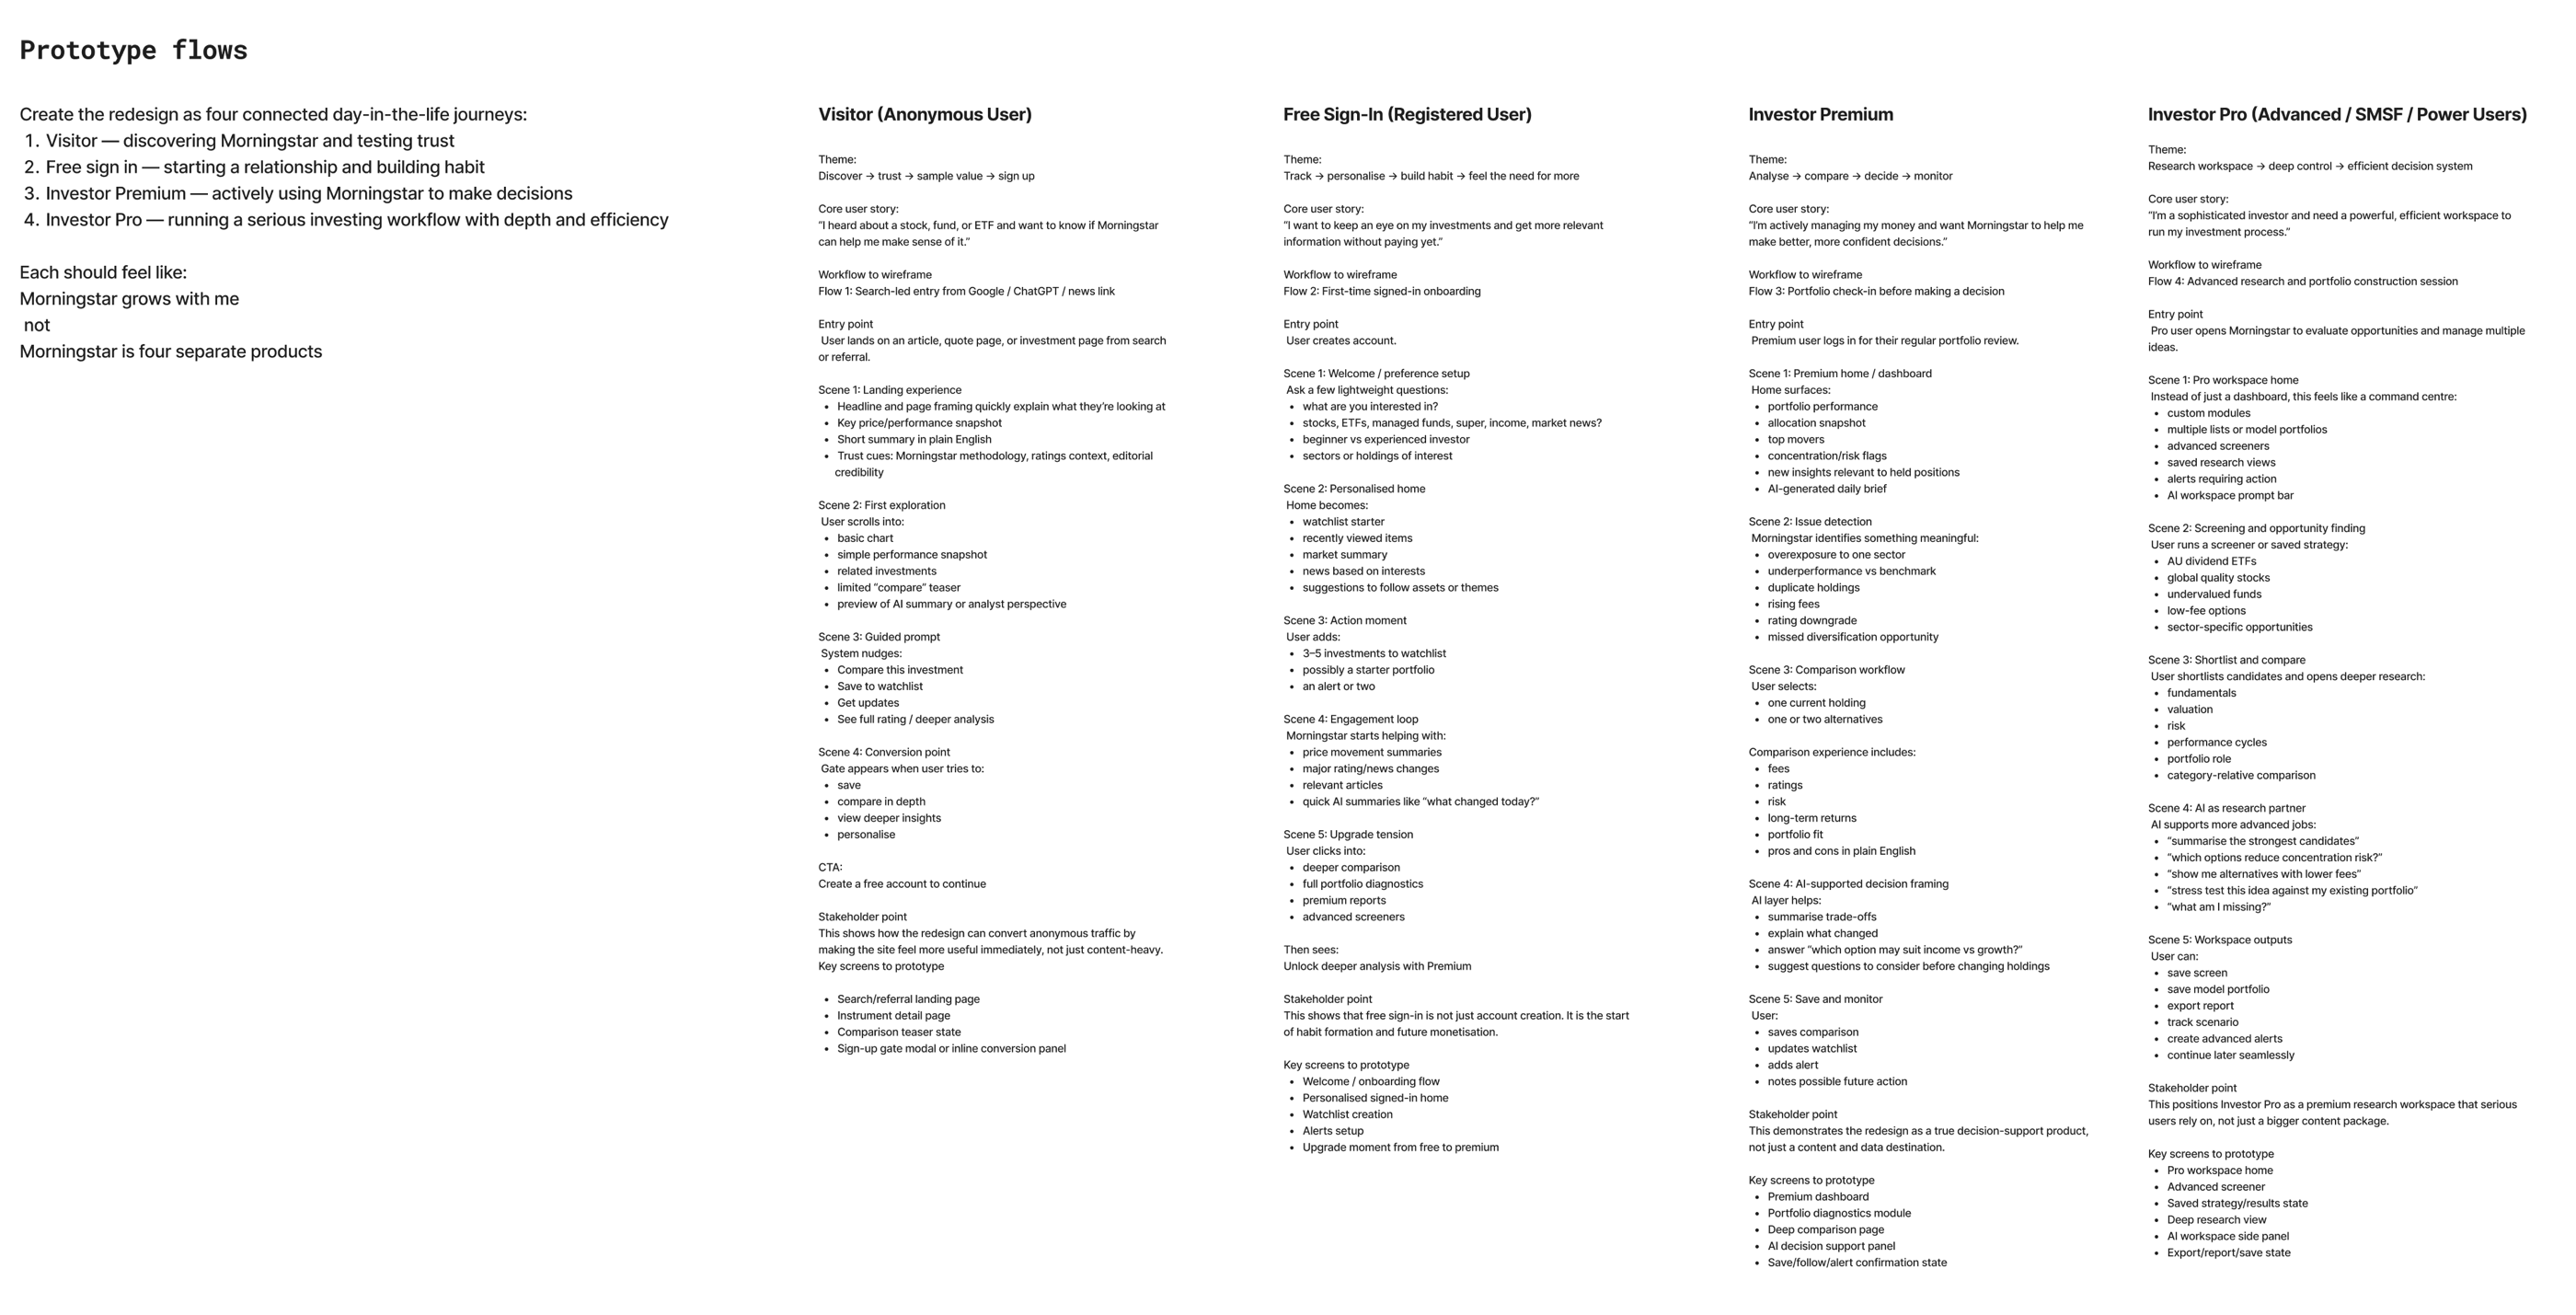 Prototype flows
 Card sort
 Card sort, similarity
 Proposed navigation
 Navigation test
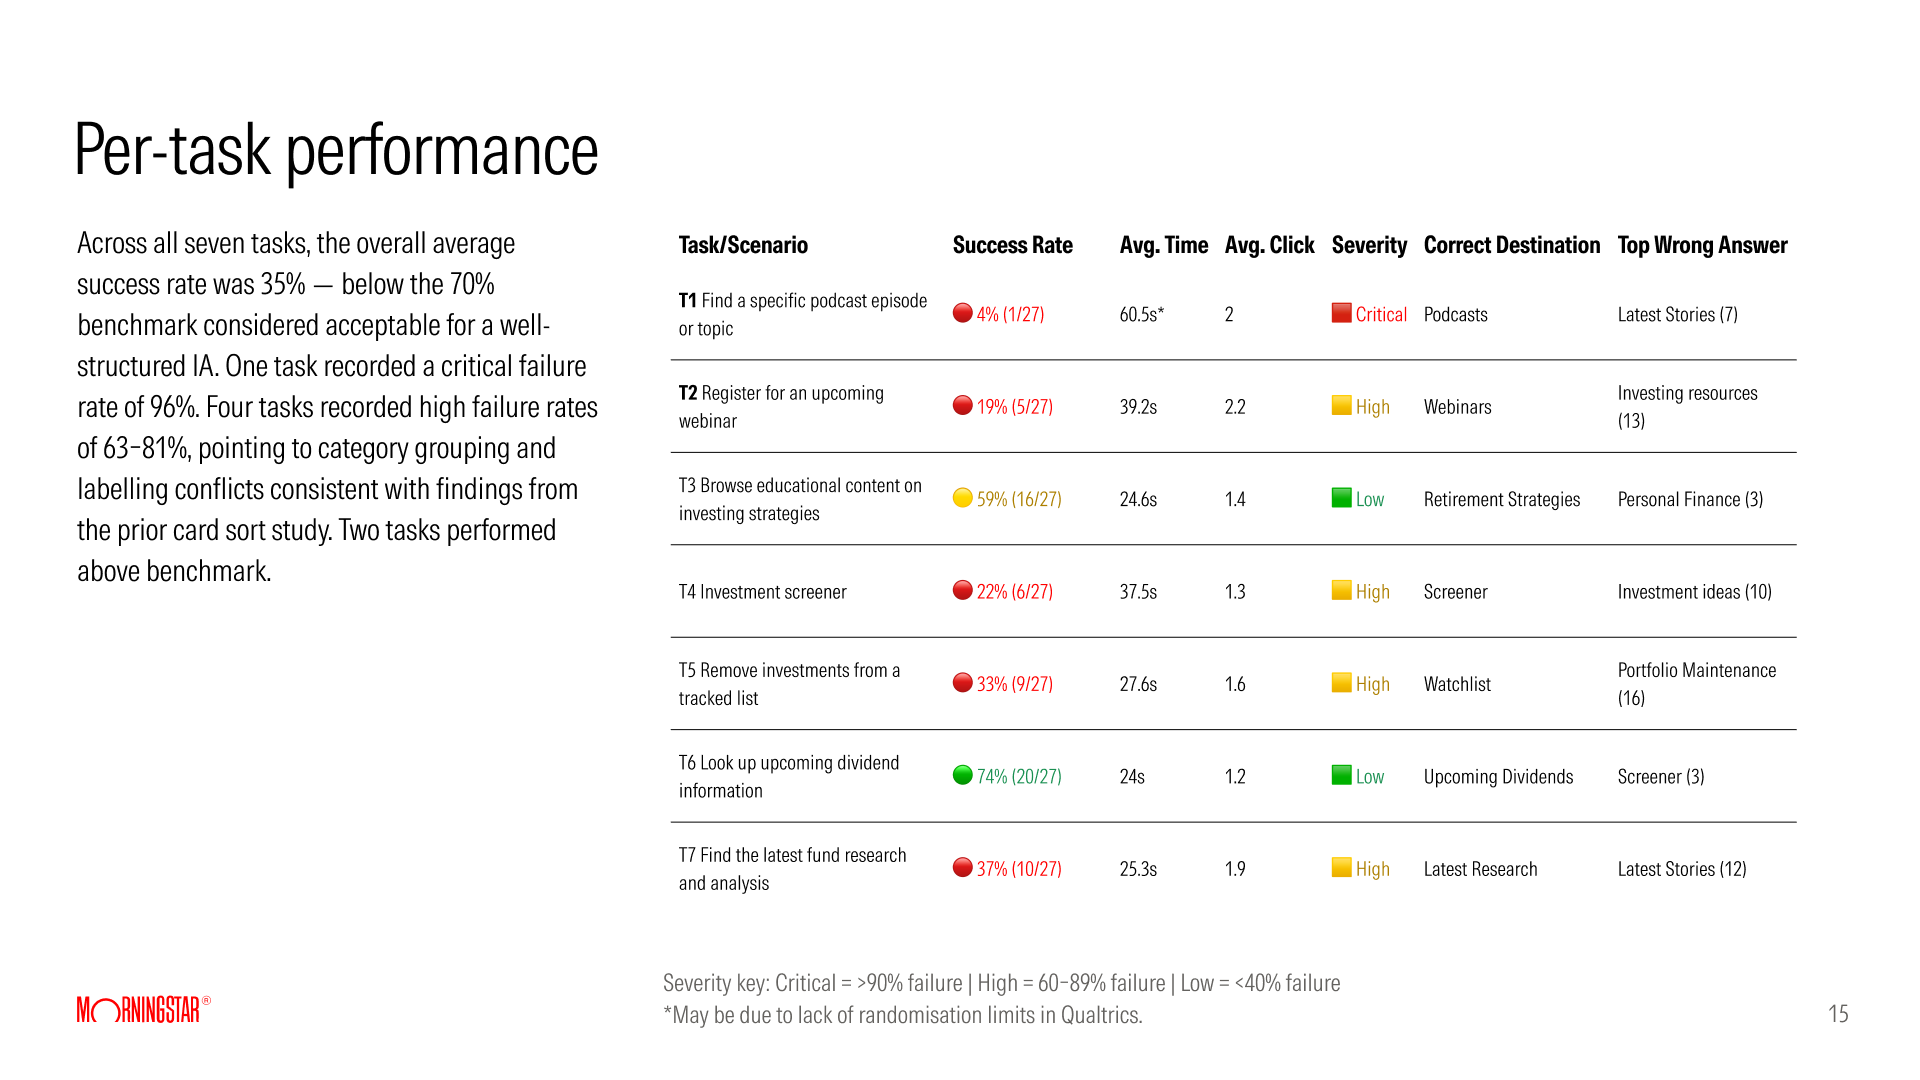 Navigation test, by task
How we got to one product
We started by looking closely at what we had, and at similar products in other markets.
I put six Morningstar sites on one board: three in Australia (two paid, one public) and three from other markets. It held about 400 navigation items. The three Australian sites organised the same content three ways: by topic, by task and by asset class.
As we looked closer, we found three signs that the two products were converging.
Overlap
The same features
Advisers used almost the same functions as investors, with more advanced tools.
Price
Advisers on the cheaper product
ARC cost more, and many advisers who cared more about research than tools bought Morningstar Investor instead.
Cost
Two of everything
Two products meant two teams, two development cycles and two sets of designs, which made them too expensive to grow.
There had been no plan to merge the products. Partway through the research we decided to build one product for both audiences, Investor Pro. My part was the audit and the comparisons, which helped the team see how much the two shared.
One product, five levels
One product had to serve a first-time visitor and an advice practice. To see where growth could come from, I compared Morningstar Investor with 30 other products across traffic, research, data, editorial, investment products and membership.
17
analysts, the most of the 31 products compared
338K
visits a month, against 2.2M for The Motley Fool
$675
a year: one price, and no free membership
The research was good, and too few people reached it. I also mapped the Australian path from visitor to paying member. A person was anonymous, on a four-week trial, or paying, so someone whose trial ended had no account to keep.
Those two findings shaped the first two levels. A visitor needs real value before paying, and Australia needed a free account that people keep.
The first sketch of the levels was free trial, investor and adviser. That would have recreated separate products inside one. We settled on five levels of one product: Visitor, Free, Premium, Pro and Enterprise.
The navigation and the layout stay the same at every level, and each level opens more of the tools and research. For each level the team wrote what the member wants and one business measure.
Visitor
"Can I trust this?"
Open editorial and locked tools, measured by conversion to a free account.
Free
"Is this useful for me?"
Working tools with limits, measured by engagement and upgrade.
Premium
"Help me make better decisions."
Analyst ratings and deeper tools, measured by retention and deeper use.
Pro and Enterprise
"I need professional-grade tools."
Tools for the advice process and shared product lists, measured by retention.
Where we wanted to go, and what could stop us
With a first version of the levels drafted, I ran two sessions with the team: a sailboat and a premortem.
The island
The goal
A platform for both audiences that devalues neither, with a soft transition for ARC users.
The sun
The opportunity
AI built into the whole product, not added as a feature.
The rocks
Risks ahead
Paid does not feel valuable, and the downgrade path is unclear.
The anchor
What slows us down
An unclear scope, and dependence on the global site.
In the premortem, we imagined the product had launched and failed, and everyone wrote down why. We got 36 reasons in three themes and cast 38 votes. The top worry was that the levels would not feel different enough.
Four of the top worries changed the design.
4 votes
Levels might not feel different
Each level got its own purpose, measure and wording, and I designed four ways for the product to hold features back.
3 votes
Advisers might lack professional tools
Pro and Enterprise became levels in their own right, built around the advice process.
3 votes
Clients not told about the change
One navigation, one look and a free level keep the change small, and the business owned the communication plan.
3 votes
Requirements keep changing
Every screen is built from one set of components, so a level can change without a redesign.
The design
The product was too big to deliver in one go. We broke it into modules and worked on them in phases, with one vision across all of them. By the time I left, the Screener, the Watchlist, Compare and the article page had been built and released.
Becoming a member
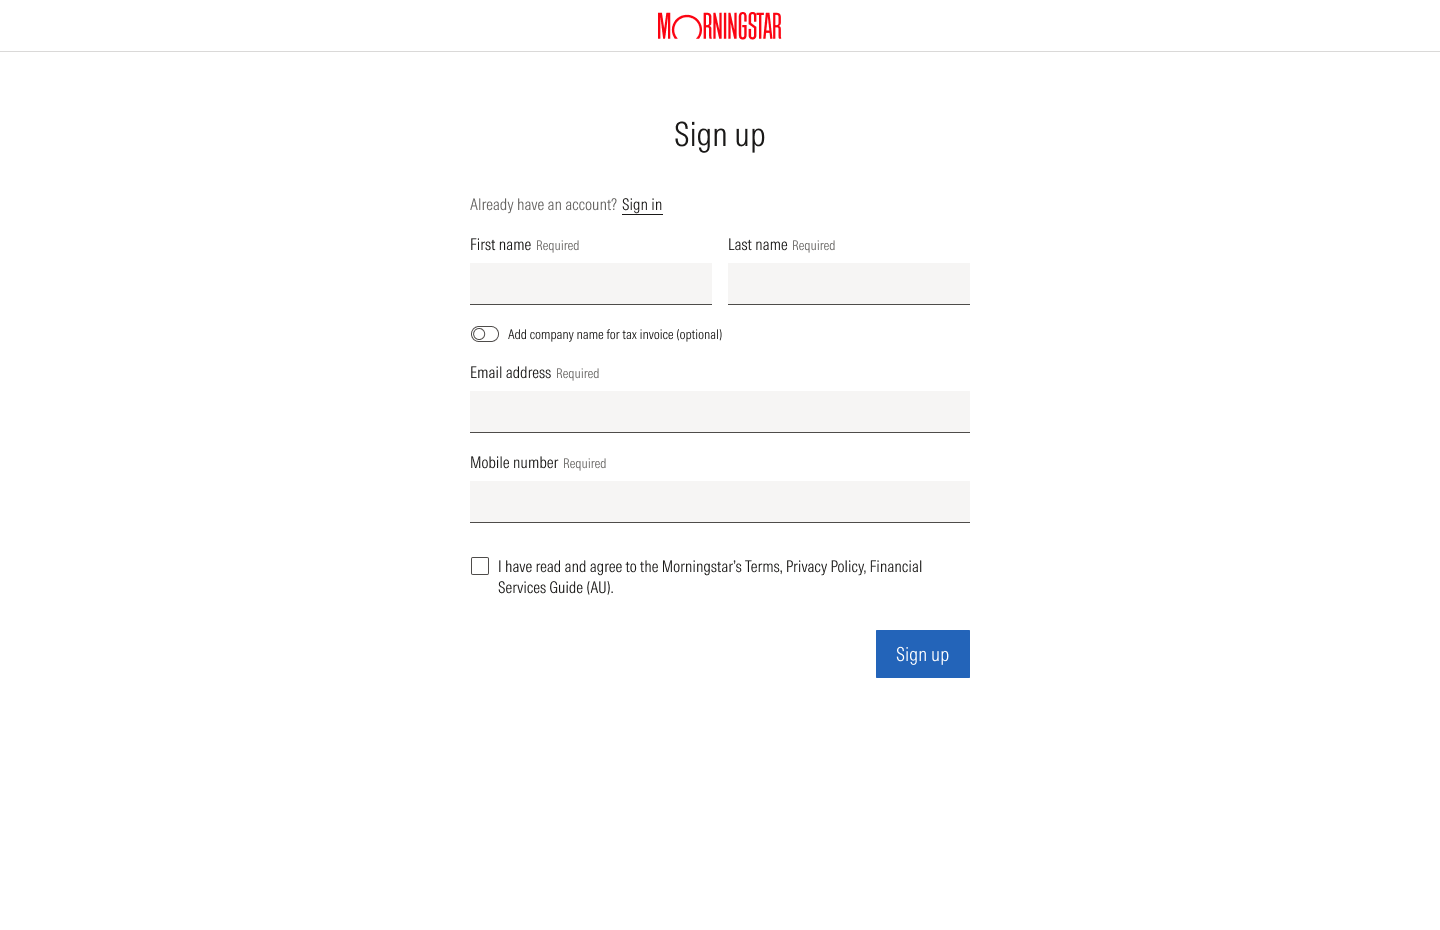
In the proposed membership path, registering creates a free account you keep. The trial moves inside Premium and drops from four weeks to seven days.
The trial asks for a card, which is a bigger commitment for the user. So in the flow I designed, the checkout states the trial conditions, the renewal date and how to cancel. Cancelling leaves you as a free member.
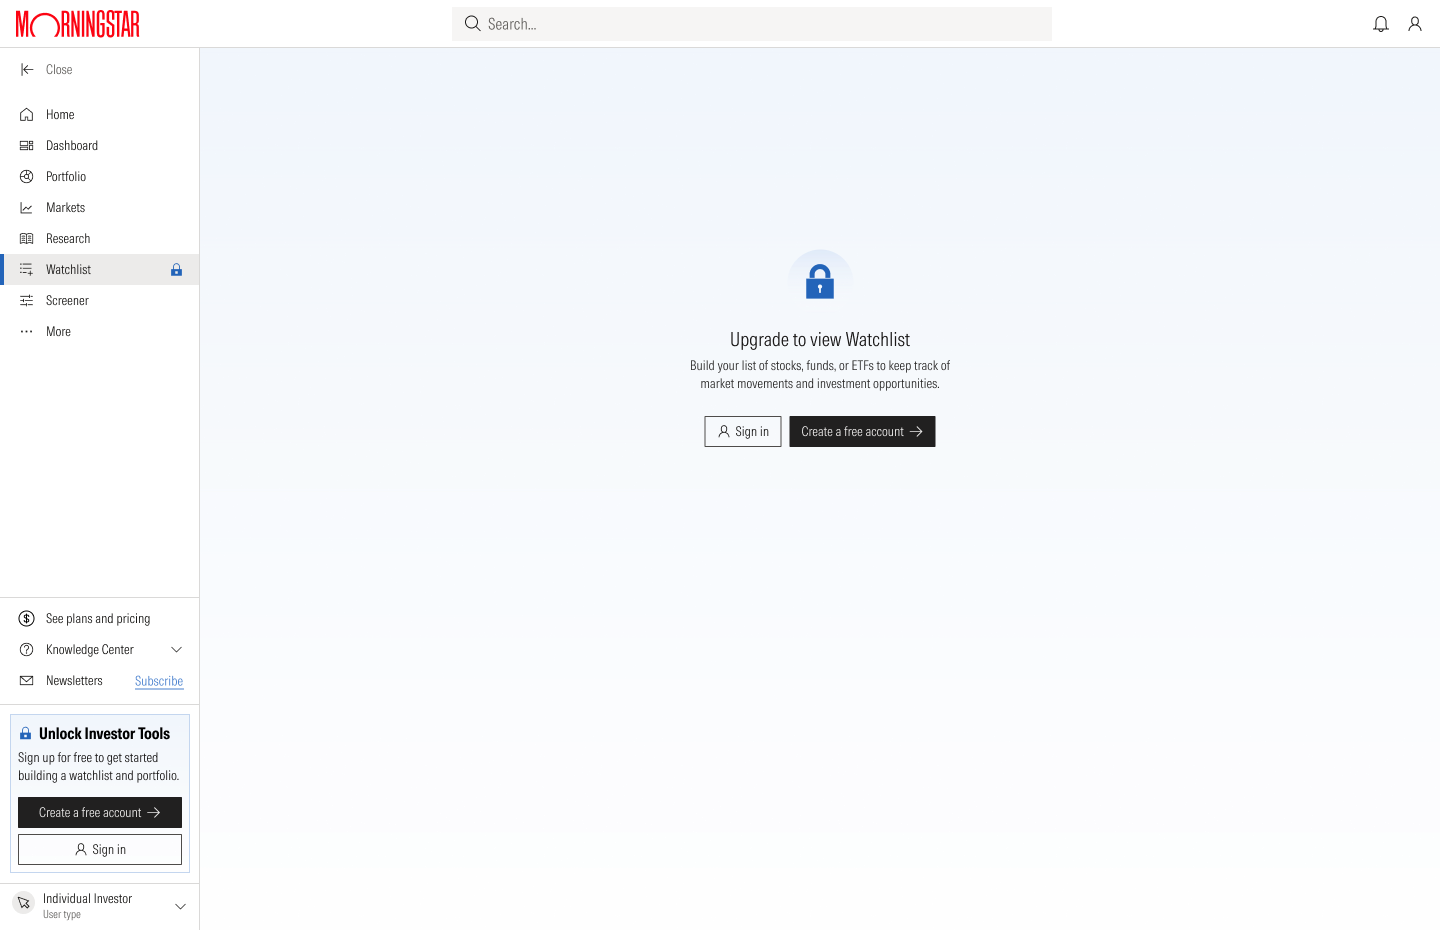
One tool across the levels
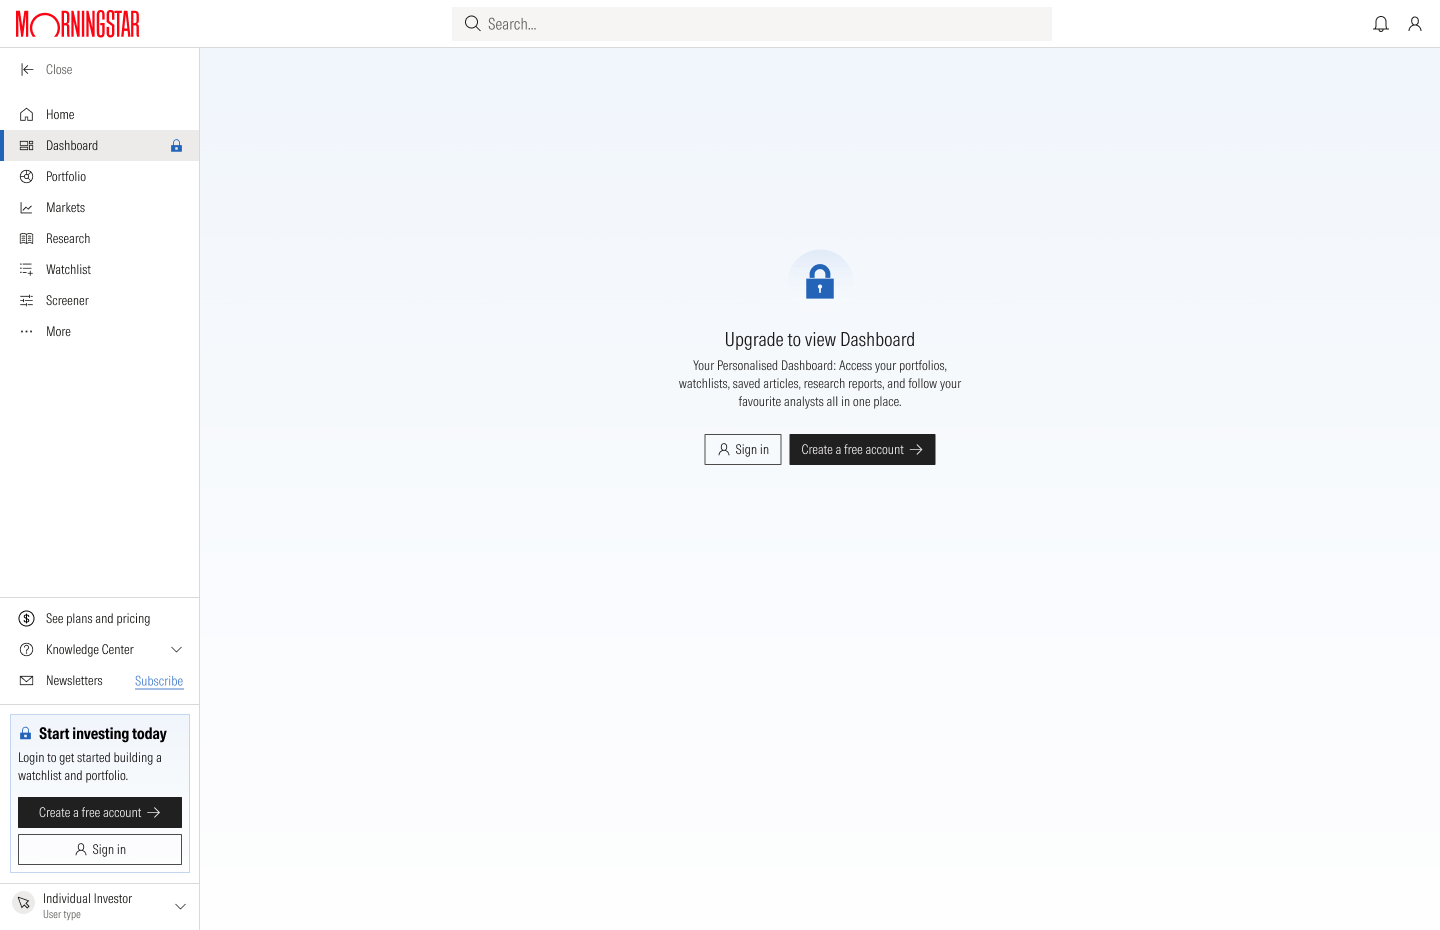
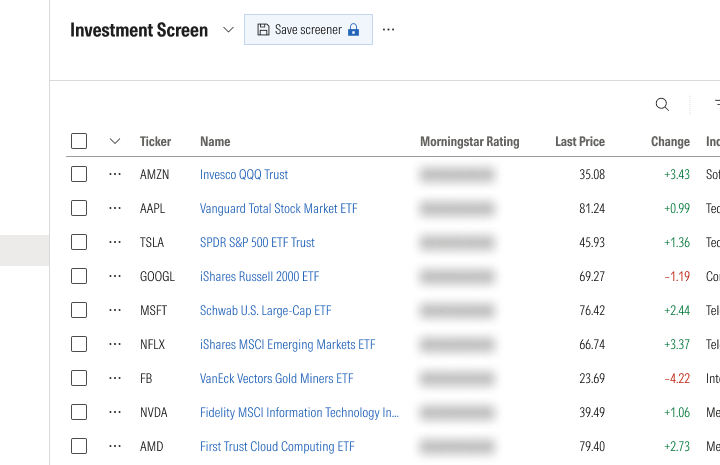
A visitor sees a locked Screener. A Free member gets a working Screener, with analyst ratings and saving held back, so the reason to upgrade is visible inside the tool. Premium opens the ratings. Pro adds column choice and export, and an Enterprise practice uses the same table to build approved product lists.
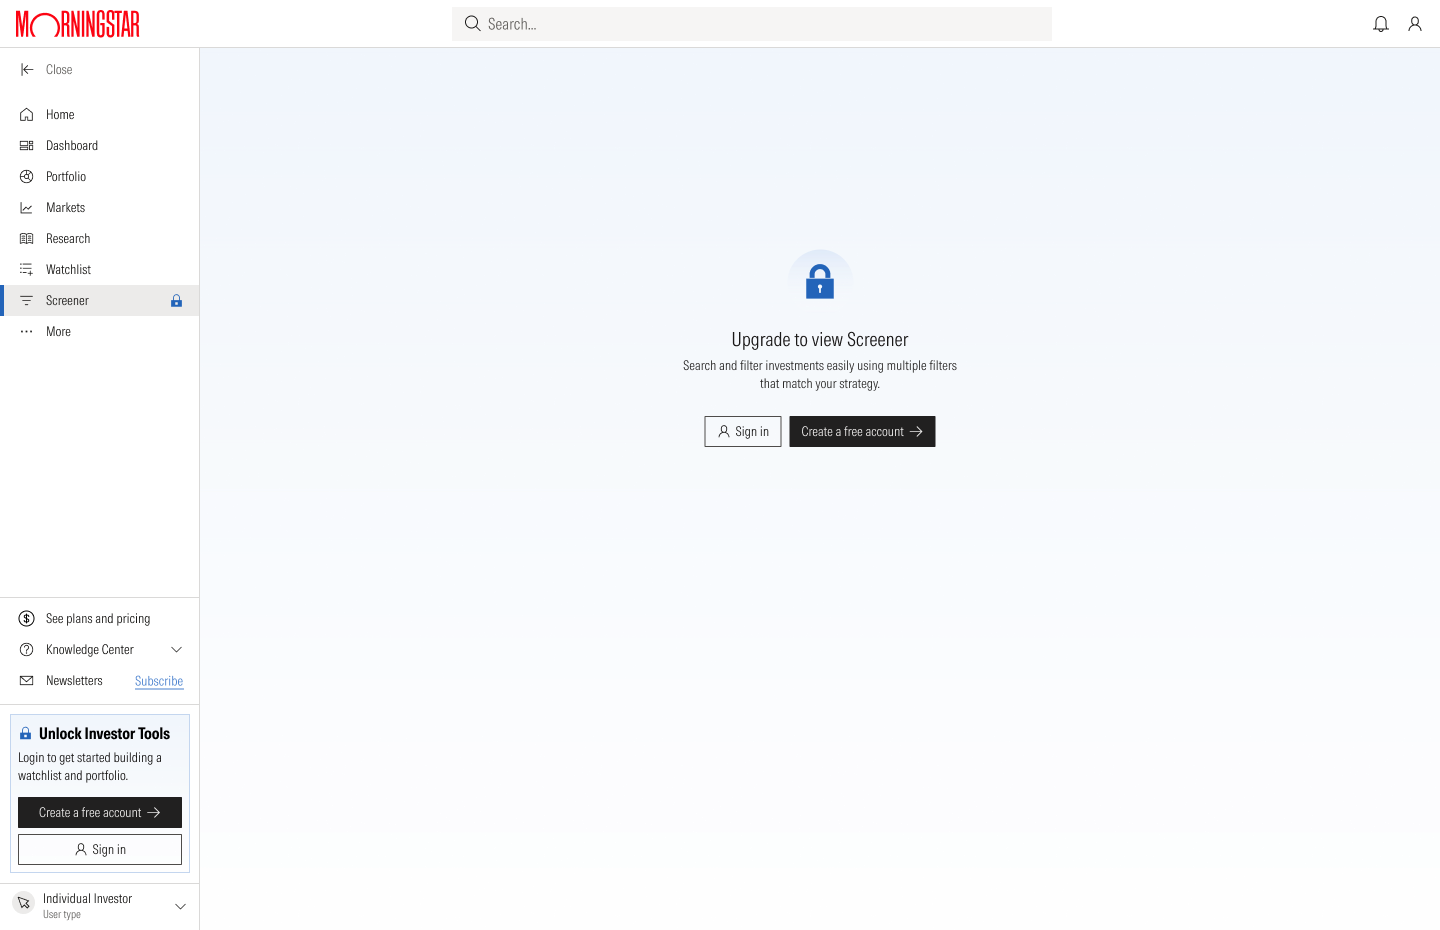


The wording changes with the audience. For an investor the Screener says "Discover investment opportunities that match your goals". For a practice it says "Build and maintain approved product lists".
Four ways to hold a feature back
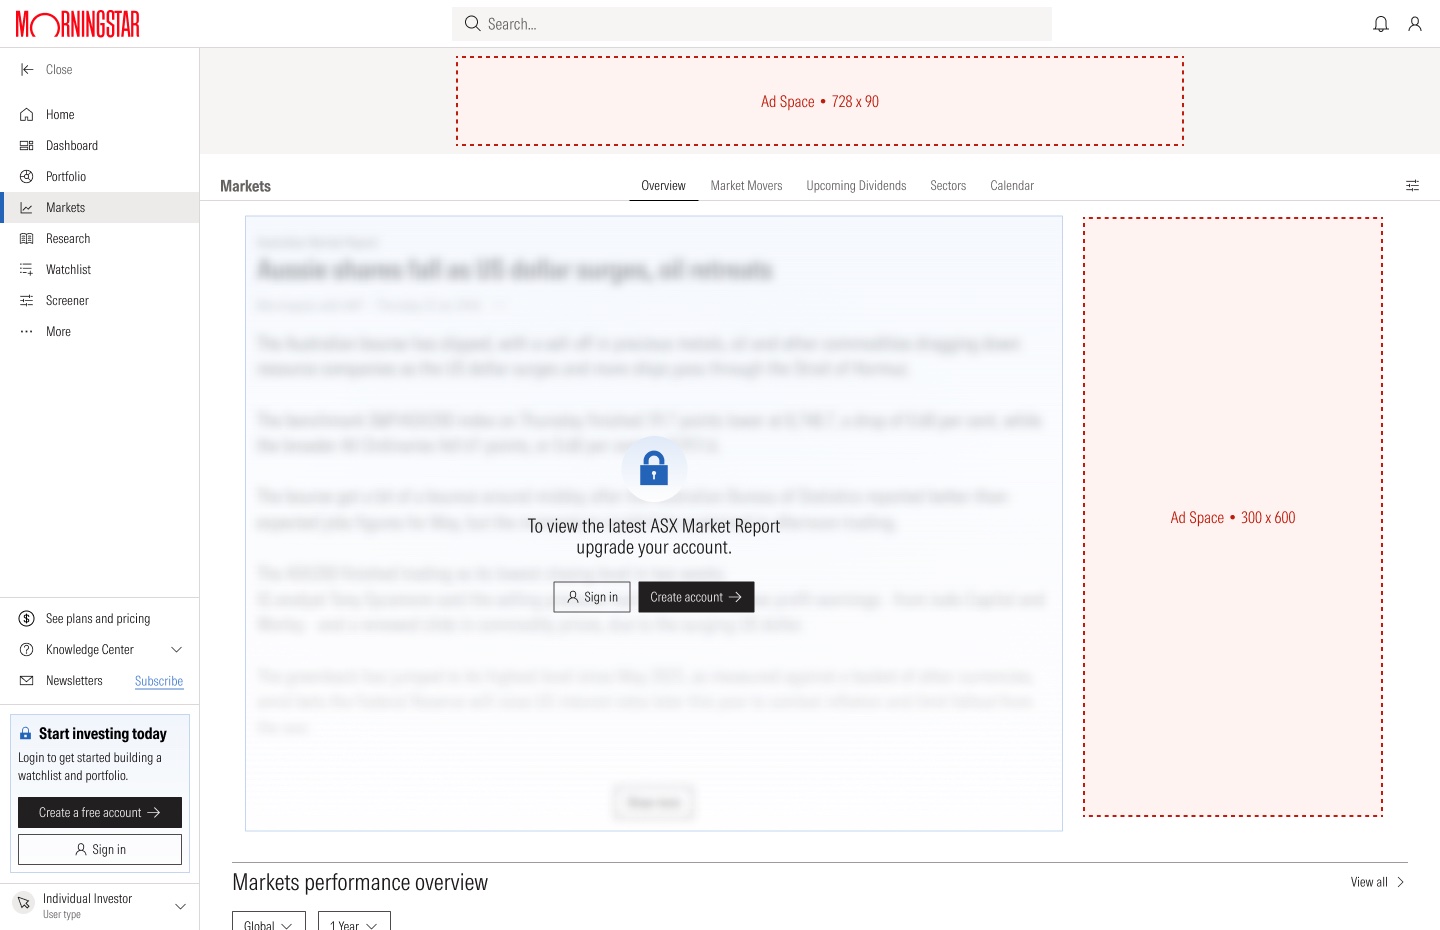
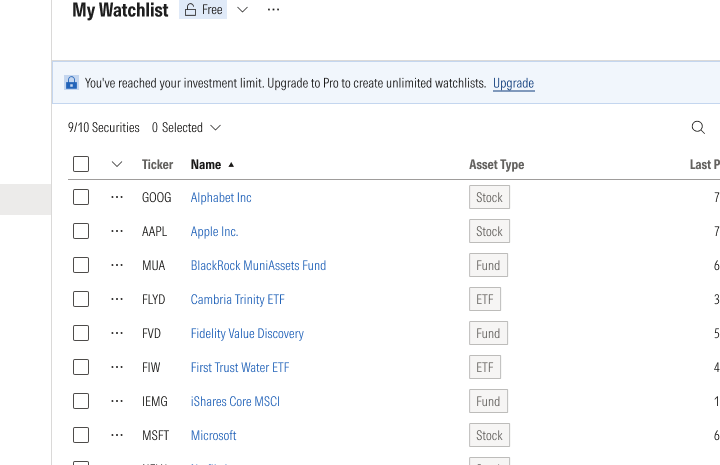
This was my answer to the premortem's top worry. I designed four ways to hold something back, from strongest to lightest: a locked page, a blurred preview, a locked feature and a visible limit. Each one shows what is behind the lock and how to open it.
What users told us
The Screener sessions I ran
I ran usability sessions on the new Screener with 12 people: six advisers who use ARC and six investors. Each person did four tasks and compared the new Screener with the one they use today. The product manager, the lead developer and a customer success manager sat in on the sessions, and afterwards they agreed to add the data advisers had asked for.
98%
of tasks completed
3.98
out of 5 for satisfaction, from the participants who rated it
88
on the System Usability Scale (SUS), against 69 for ARC and 59 for Morningstar Investor
The six advisers, all ARC users, were clear about what ARC lacked overall, not only in the screener.
- ExportAdvisers download a CSV from ARC and work in Excel. They want to export data and add their own ratios.
- ColumnsMore detail in the columns, so more can be read on one screen, and a summary page for quick reference.
- RatingsThe difference between the Morningstar Rating and the Medalist Rating is not clear.
- CategoriesThe Morningstar Category list is very granular. One adviser called it intimidating.
- AvailabilityPlatform and wrap availability is valued in a fund screener, and should stay.
- SearchThe current ARC screener is not easy to use, so some advisers avoid it. It does not search widely enough or show enough ratios.
- NavigationThe current site is hard to find your way around and hard to compare funds in. Advisers wanted the tools they use most, like the screener, reachable from the front page.
- ScopeAdvisers want to manage international holdings alongside Australian equities.
- AIOne adviser wanted to ask questions of Morningstar's data in plain language, rather than build queries by hand.
- ReportingAdvisers asked for fuller portfolio reporting and better tools to analyse the data.
- Look and feelThe new Screener was rated four out of five, with a note that it could be more attractive to use.
- Client-facing visualsAdvisers use visual illustrations to explain investments to clients, and want tools that support that.
The six investors ranged from beginners to people who do their own analysis in Excel. Like the advisers, most of what they raised was about the current site, not only the screener.
- Plain wordsOne newer investor did not know terms such as "investment screener" and asked for simpler labels, with a short explanation where a term could not be avoided. She said the site felt like an information dump.
- Notes and savingMore than one investor wanted to add their own notes to an investment, a watchlist or a portfolio. One could not save funds to come back to.
- SpeedTwo investors said the site is slow.
- NavigationPeople wanted more rows on a page, a way to set how many show, and links that open in a new tab. One lost his place when he sorted a list and sorted it again.
- CompareOne investor wanted to pick several stocks and compare them side by side before deciding.
- FilteringOne investor showed how he filters for stocks with a dividend yield above 8. He wanted a filter that is strong and easy to use.
- NewsOne investor said that after screening he watches a stock for a while and follows its news. Another wanted news alerts on the companies he holds in one place, instead of visiting several sites.
- DataExperienced investors wanted fields the tool did not have, such as beta, data over long periods and ESG factors, and a way to pull it into Excel. One wanted to see the assumptions behind the analysis, such as the discount rate and growth rates.
- Portfolio toolsTools for building and analysing a portfolio, such as correlation between markets, were available to advisers but not to investors. One investor wanted to set up a hypothetical portfolio and get alerts on it.
- SearchThe main search on the site moved when clicked, which annoyed one investor. Another said search did not work the way he needed.
- Look and feelOne investor called the design flat and monotonous. Another asked for darker text and for investment names in blue, as he was used to, so they read as links.
- MobileOne investor avoided the site on a phone for screening, but used it there to read up on a single stock.
Both groups
Everything on one screen
What people liked most was not jumping between pages: filters and results share one screen.
Advisers
More data, and export
They asked for more columns, spreadsheet export and saved screens with alerts, so column choice and export went into Pro.
Investors
Plain words
Beginners stumbled on terms such as capital allocation, so we rewrote labels and added short explanations.
Navigation research
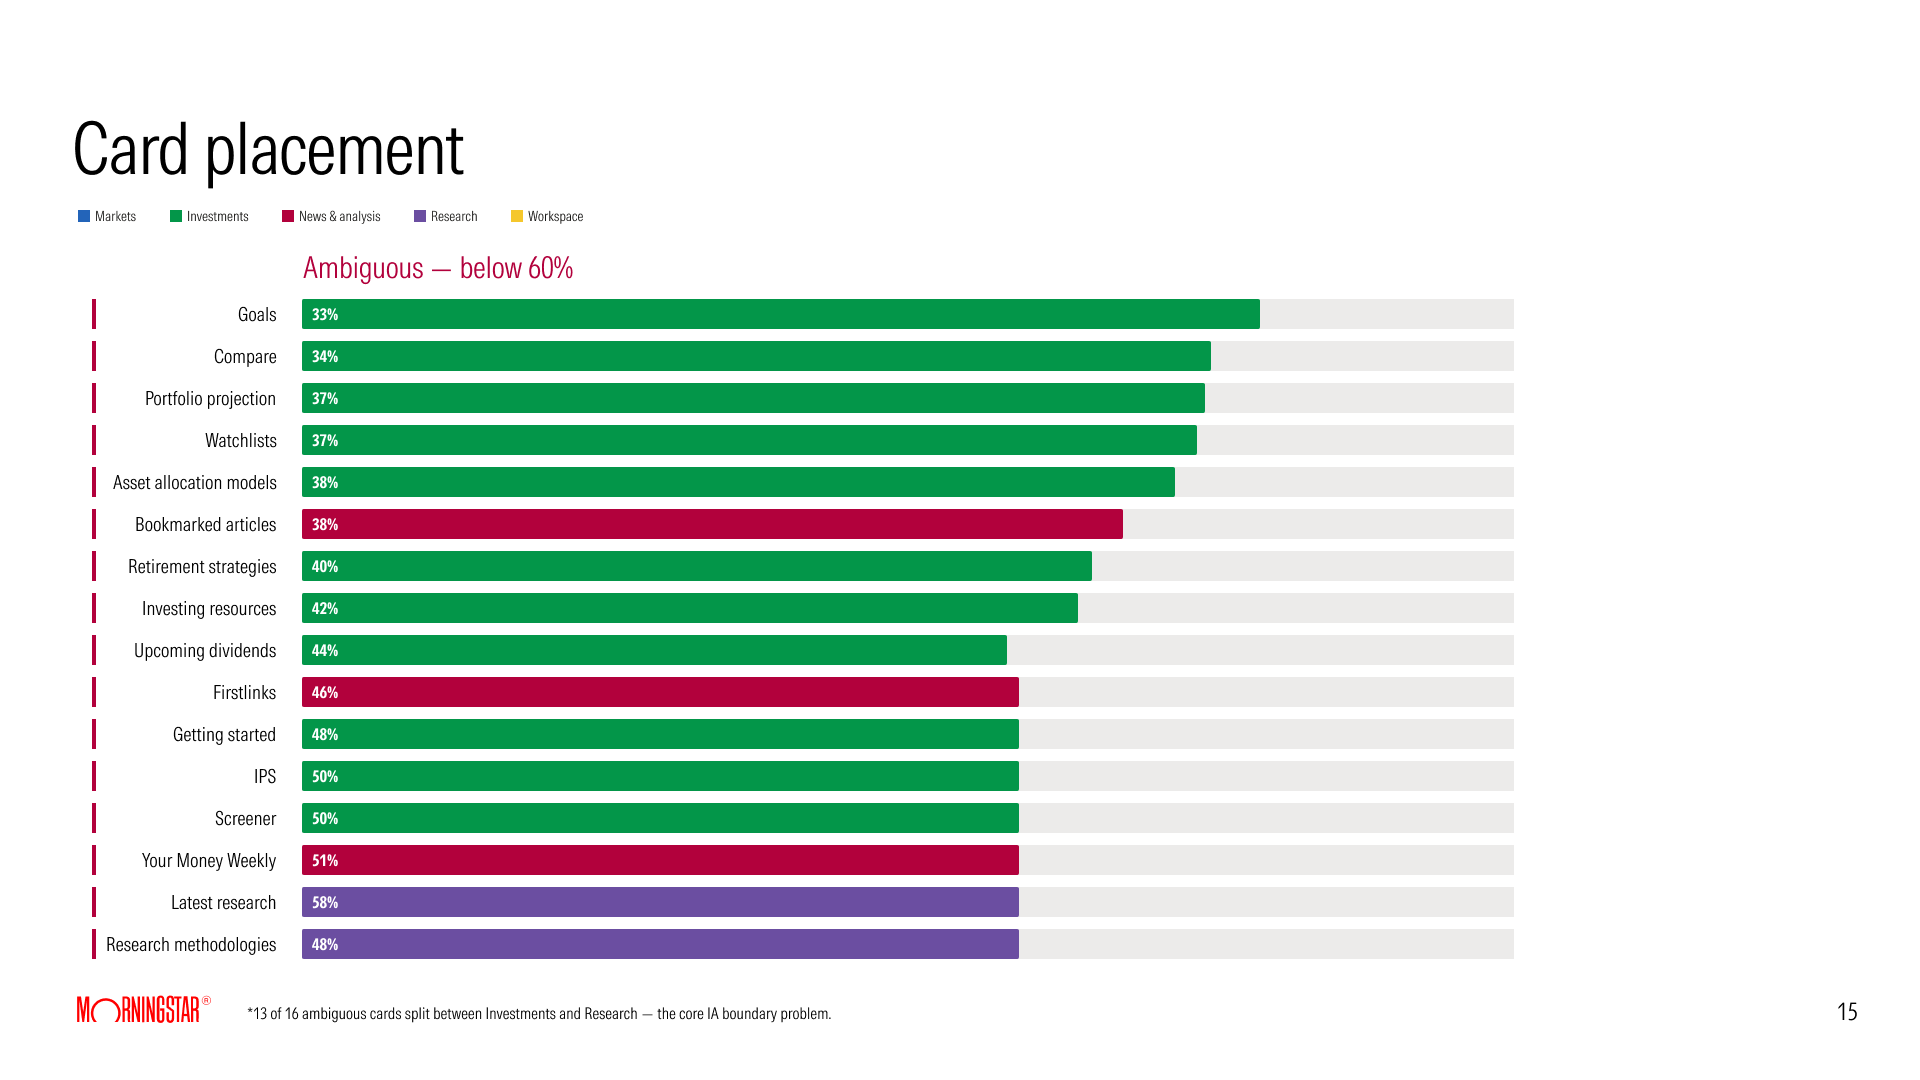
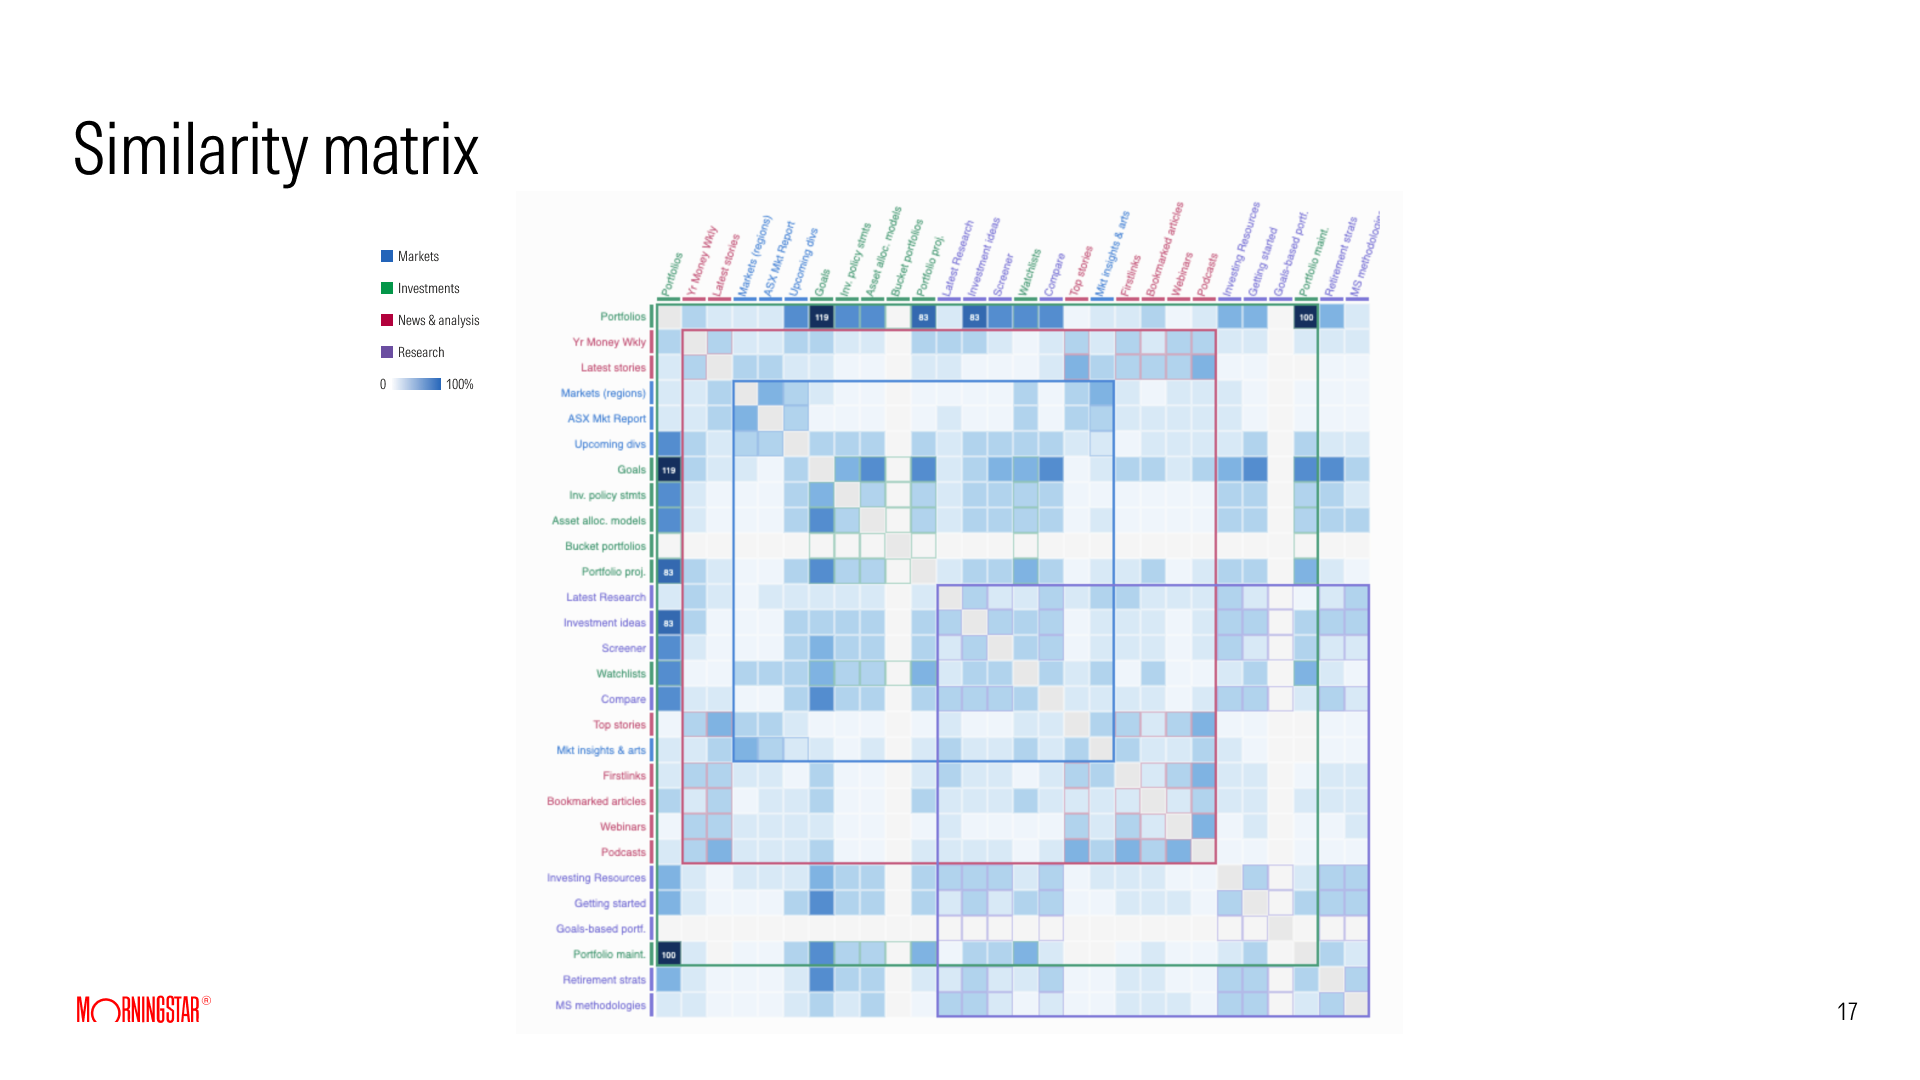
I ran two studies on the navigation. In the card sort, 36 investors and five advisers grouped 28 menu labels taken from my audit. Both groups agreed on Markets, both mixed up Investments and Research, and both asked for a Learn section without being offered one.
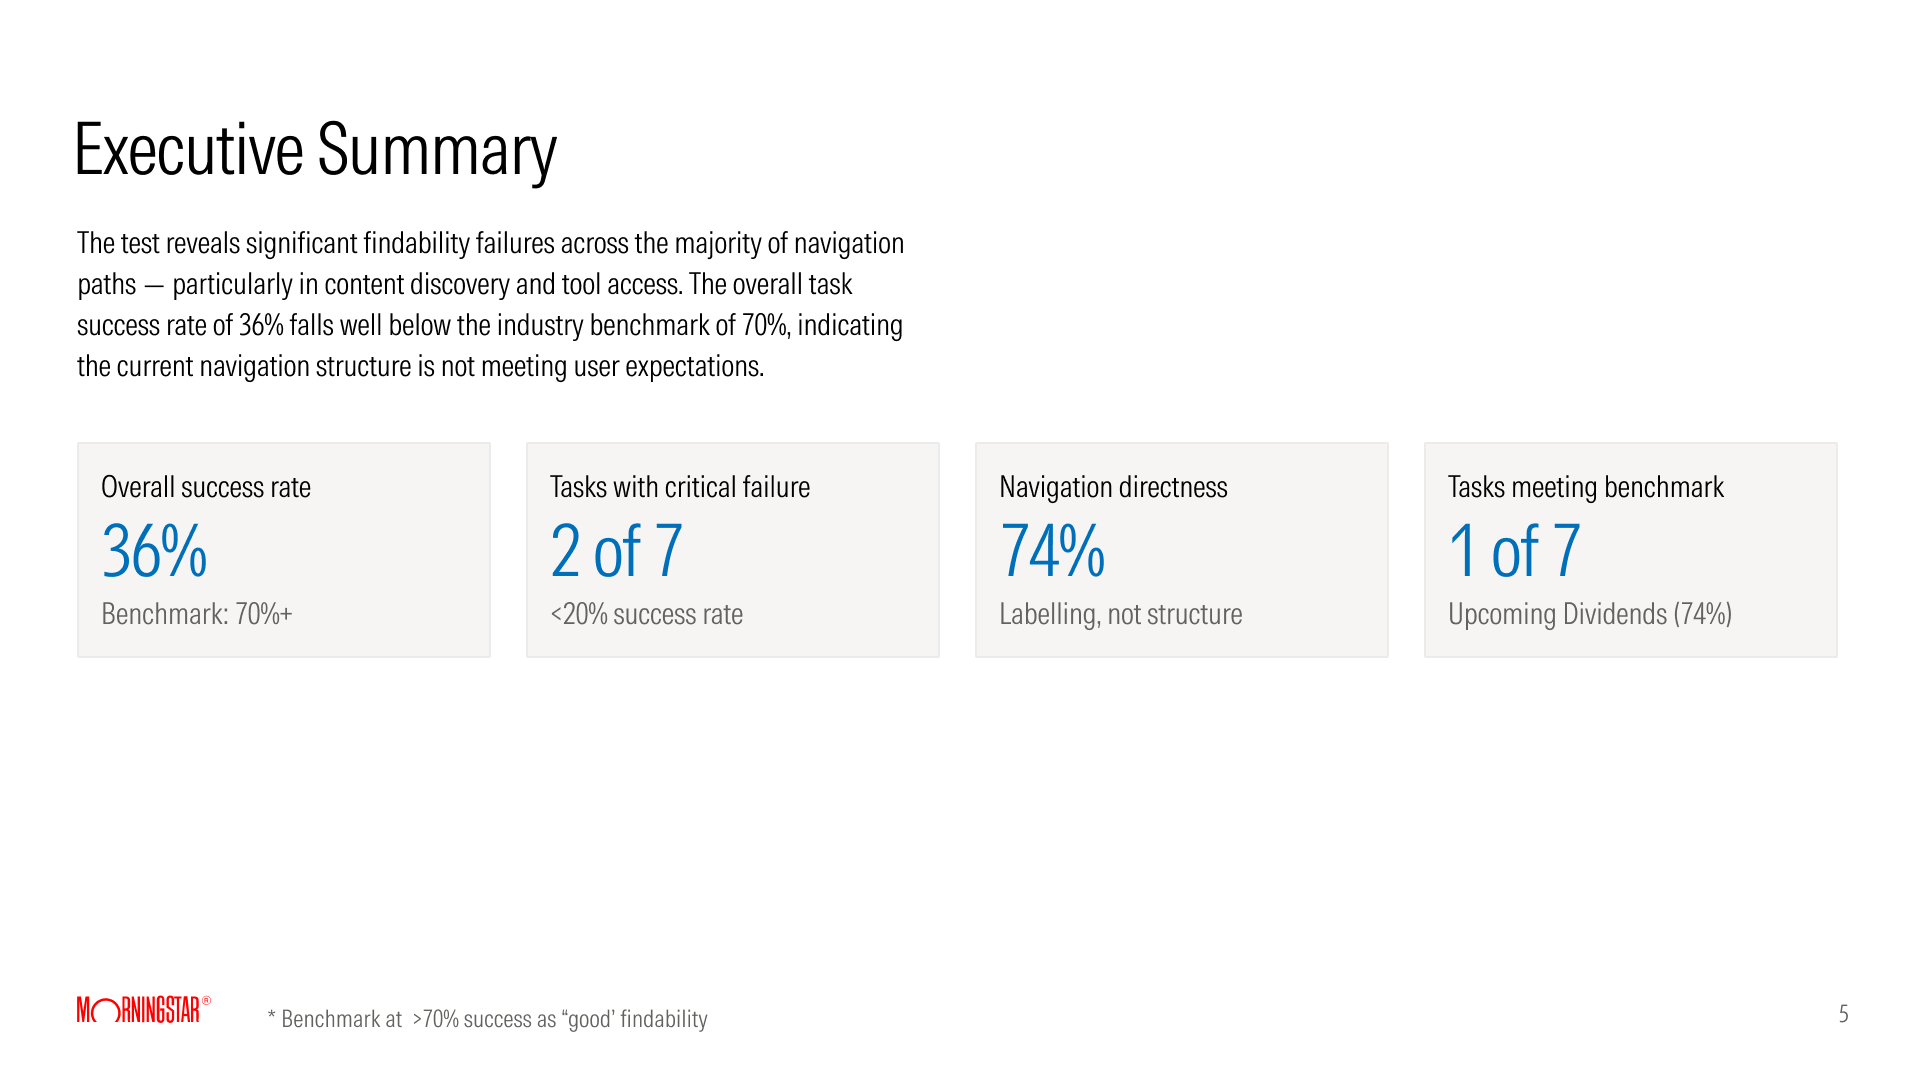
In the navigation test, 27 investors did seven tasks using only the menu labels.
74%
went straight to an answer
36%
got it right, against a 70% benchmark
1 of 7
tasks passed: upcoming dividends
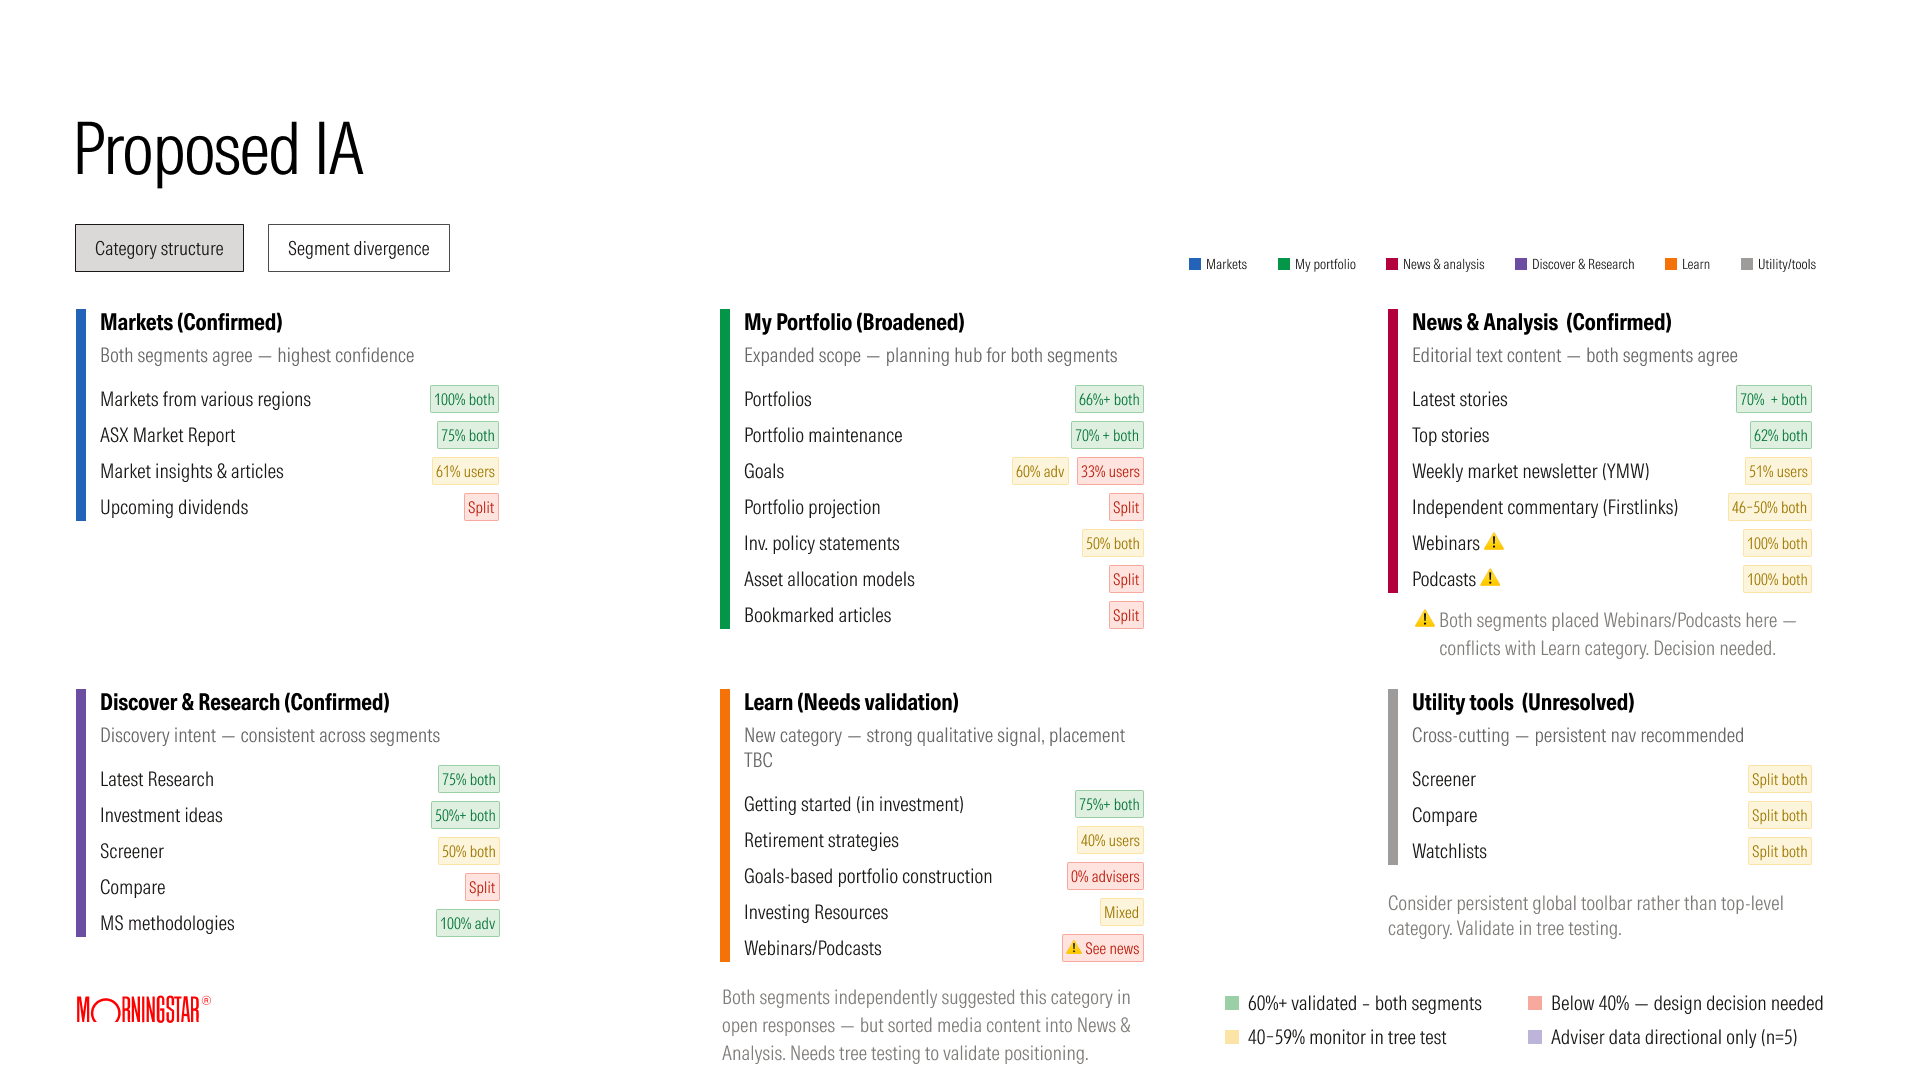
Together the studies pointed to six sections: Markets, My Portfolio, News and Analysis, Discover and Research, Learn, and utility tools. People were confident and wrong, so we kept the structure and rewrote the labels in the user's words. In the screens I separated Watchlist and Screener from Portfolio.
Advisers started from research and investors from news, but five advisers were too few to decide on. I did not build a separate adviser navigation, and one navigation serves every level.
The design system
Morningstar's design system had basic elements and a few components, with no page layouts and only basic table behaviour. We built a set of components and page layouts on top of it: tables, filters, navigation and charts. Other Morningstar products later used the same set, including AdviserLogic and Morningstar UK.
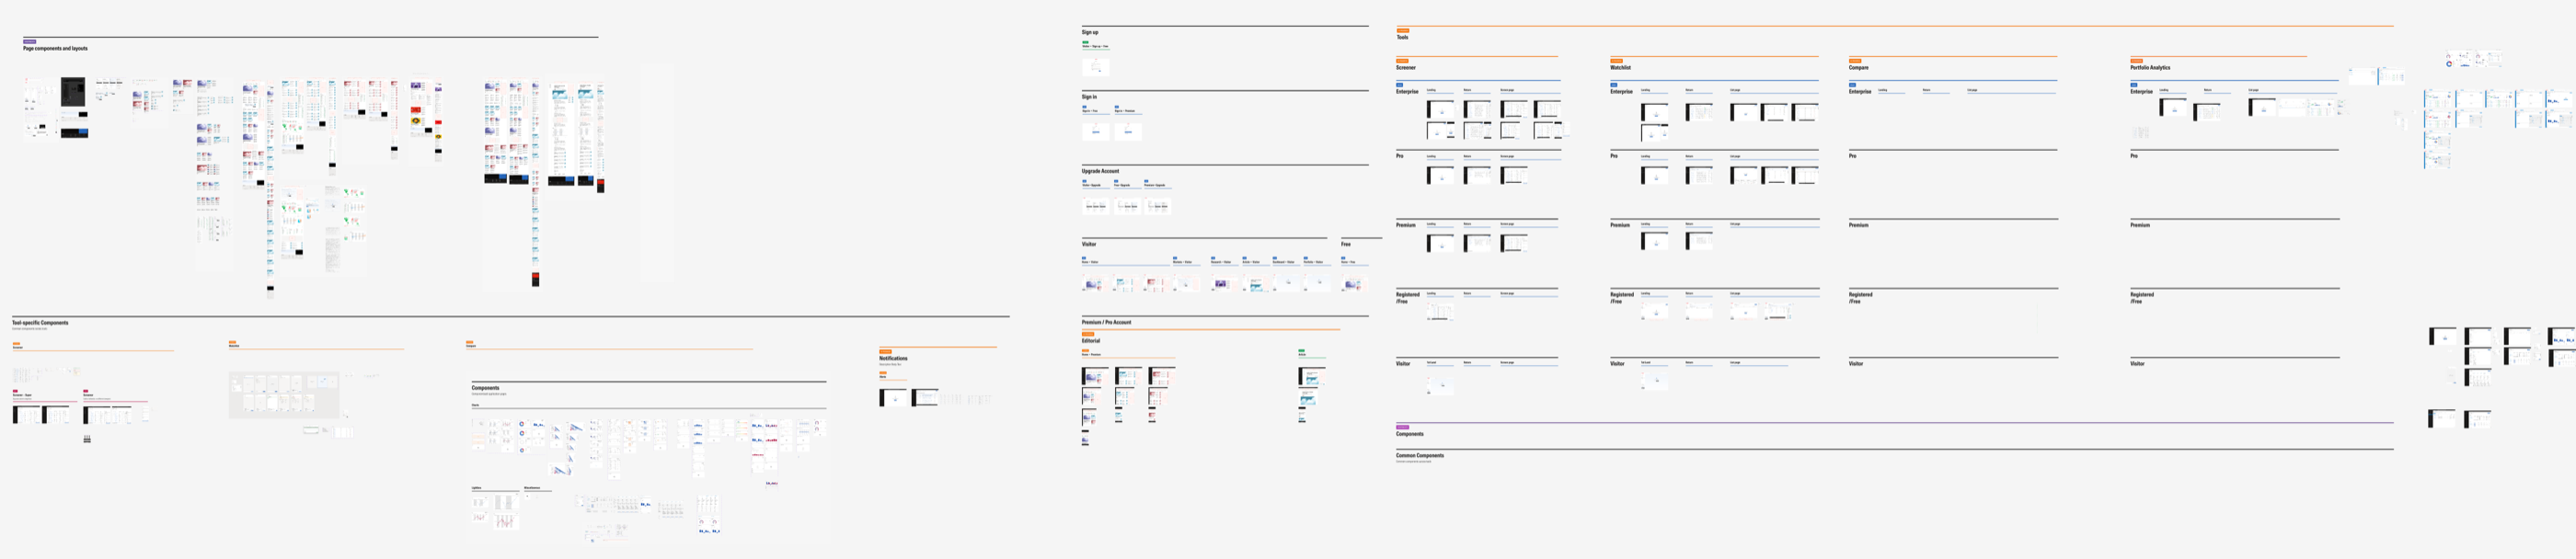
I designed the Investor Pro screens from that set: more than 100 screens at three sizes, from more than 370 components. I laid out the Figma file as a grid, with tools in columns and levels in rows, so anyone on the team can find a screen.
Outcome
By July 2026 four modules had been built and released: the Screener, the Watchlist, Compare and the article page. Two measures moved while I was there. The new Screener scored 88 on the System Usability Scale in sessions with 12 advisers and investors, against 69 for ARC and 59 for Morningstar Investor. The Net Promoter Score rose from 29 to 67.
The work left the team one direction in place of two products, with five membership levels and a free level Australia did not have. It also left a proposed membership path with clear terms at checkout, rewritten navigation labels and one component set.
I left Morningstar in July 2026, before the growth, retention and conversion results were in.
What I learned
I would run a premortem on every project. The team named its biggest worry early, and that worry led to the four ways of holding a feature back.
I would push for the navigation research before the screens. The navigation test arrived near the end, and three months earlier it would have given the first screens better labels.
I would also recruit advisers first. Five could not tell us whether navigation should change by role, and that question was still open when I left.